Sources and image credits
ChartGlow social posts, October 20–25, 2026. Each source entry identifies the period and unit shown. Background photos are illustrative assets and are not evidence for the chart values.
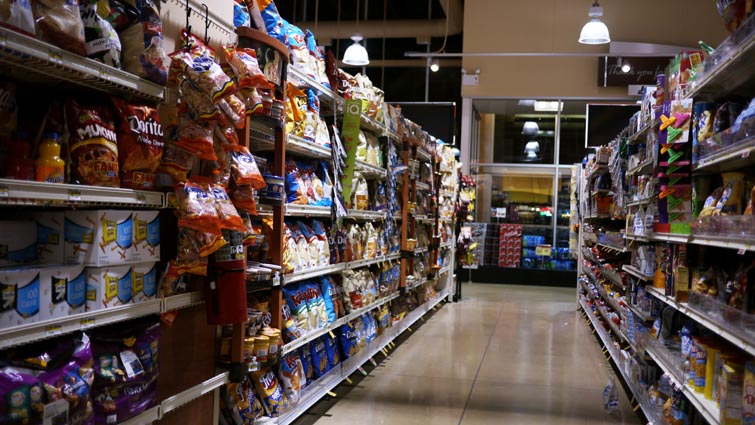
CPI • CC0
Alanthebox, Potato Chip Aisle, CC0 1.0. Illustrative grocery-aisle scene; not BLS imagery.

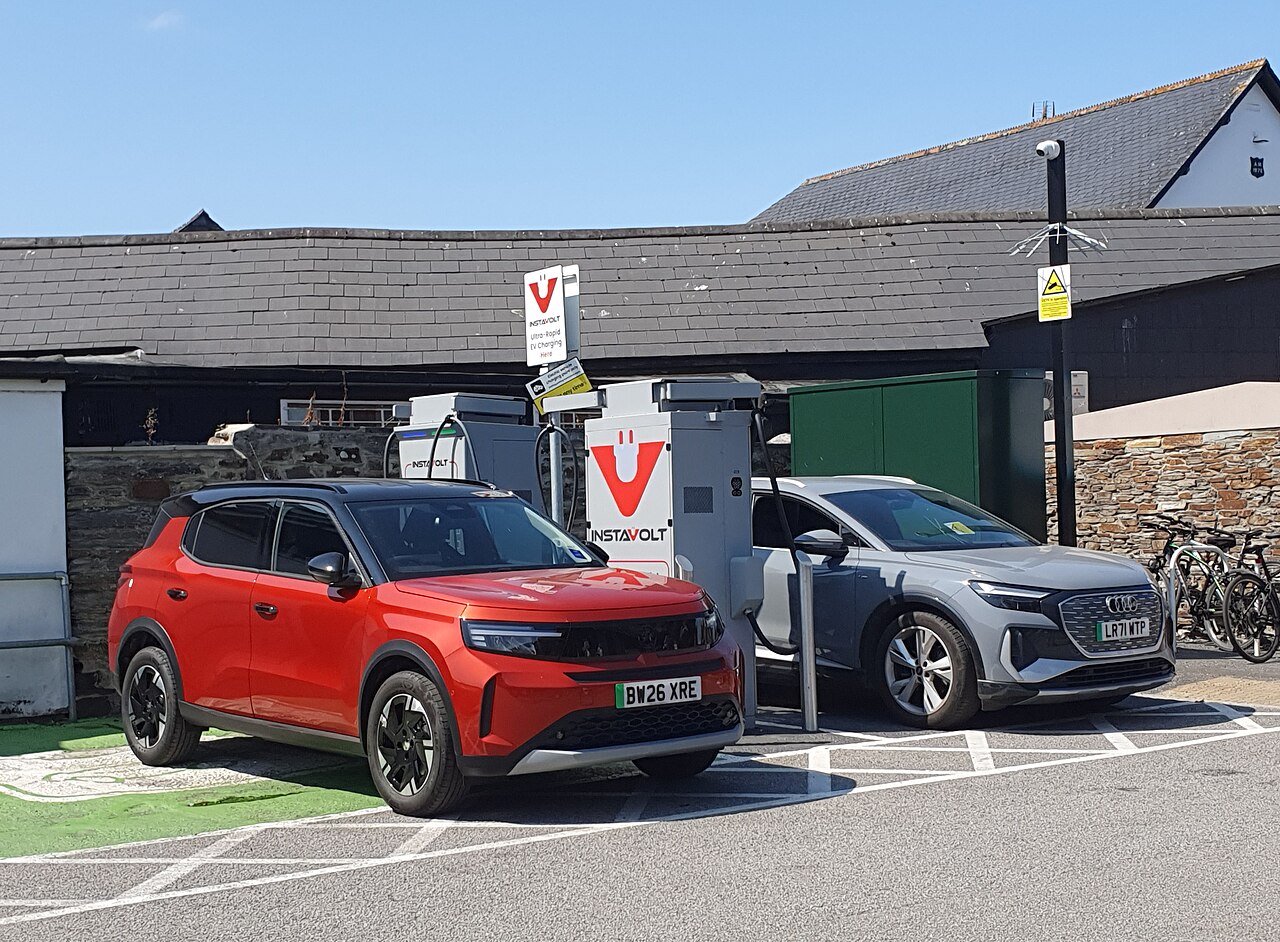
EV • CC BY 4.0
Mutney, Wadebridge charging point (15 Aug 2026), CC BY 4.0. Specific cars and location; no endorsement implied.

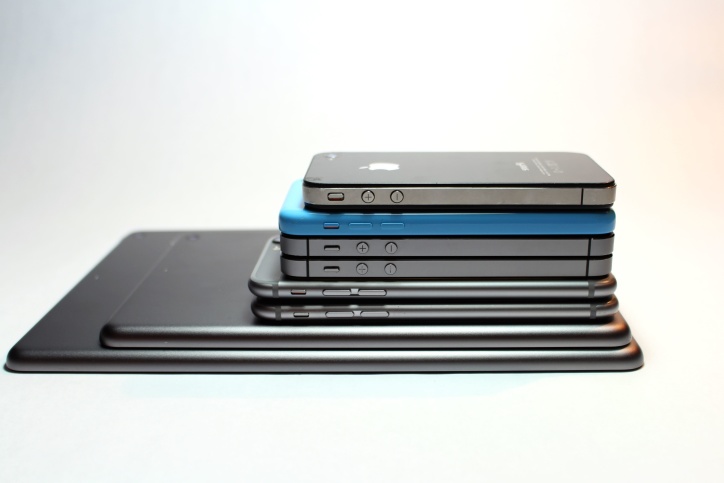
Apple devices • CC0
Gabriel Freytez, Apple Devices, 25 January 2017, CC0 1.0. Historical devices, not iPhone Duo or current models. Scaled and positioned in the native chart; no AI image.

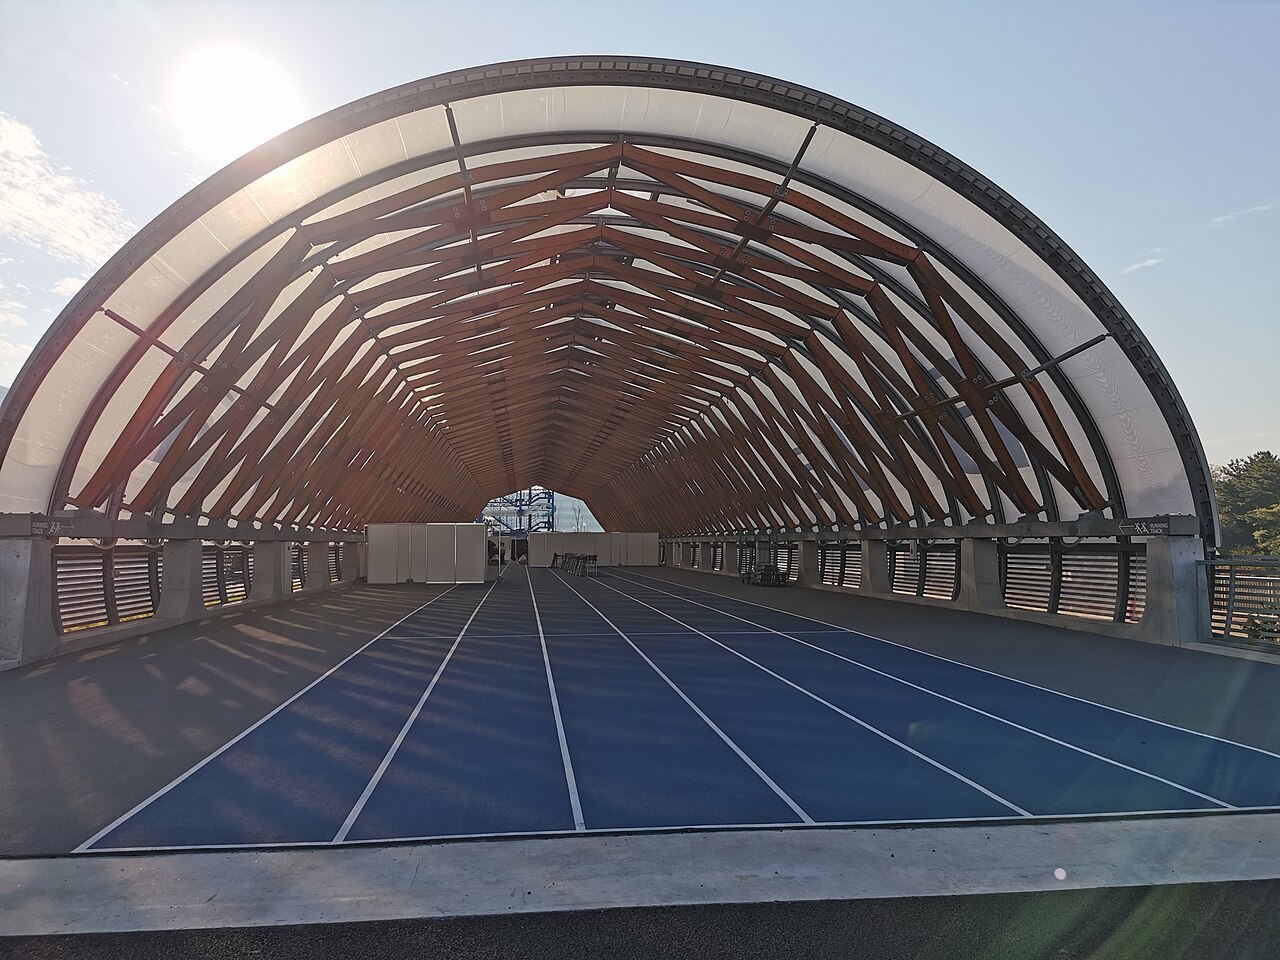
Sport • CC BY 4.0
Petewarrior, Brillia Running Stadium track, CC BY 4.0. Empty 60 m indoor training track; not a record-race venue.

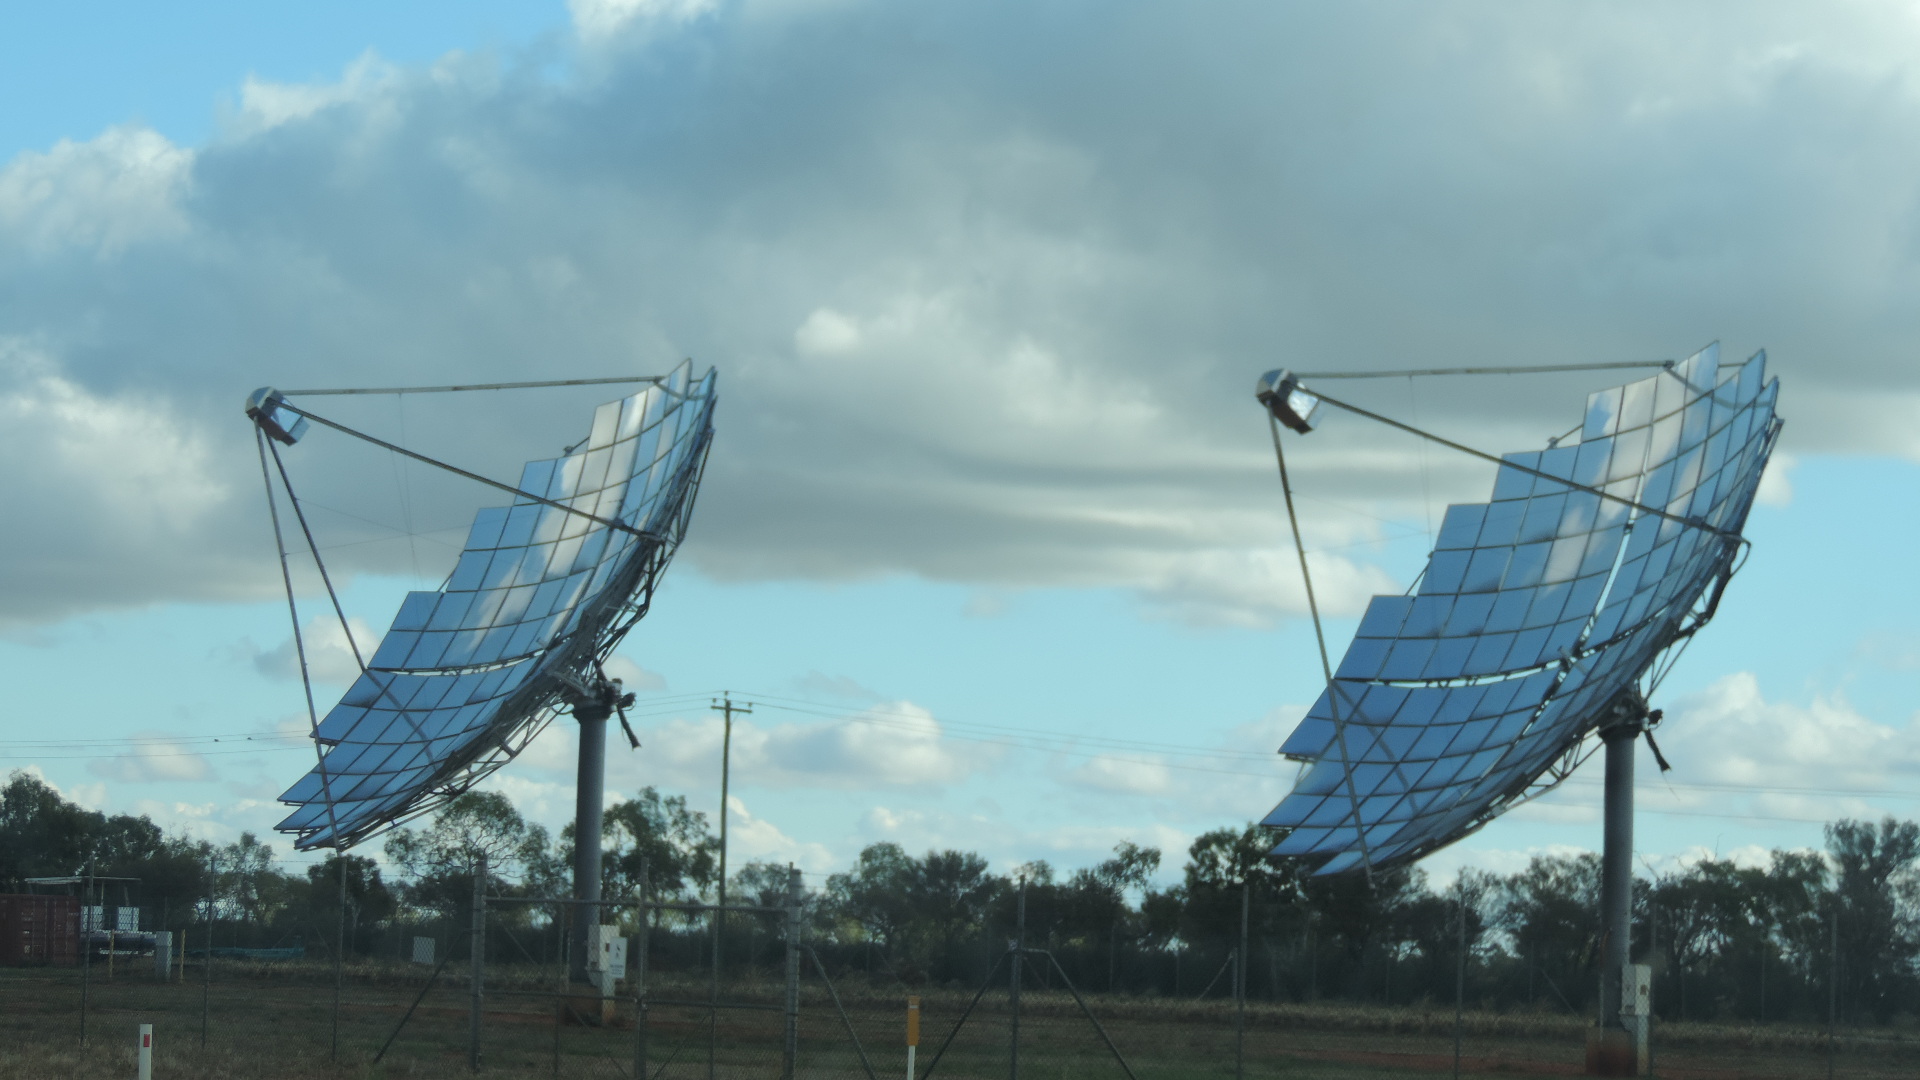
Renewables • CC BY 4.0
Kerry Raymond, Windorah Solar Farm, 2019, CC BY 4.0. Solar thermal site; not identified in IRENA’s capacity data.

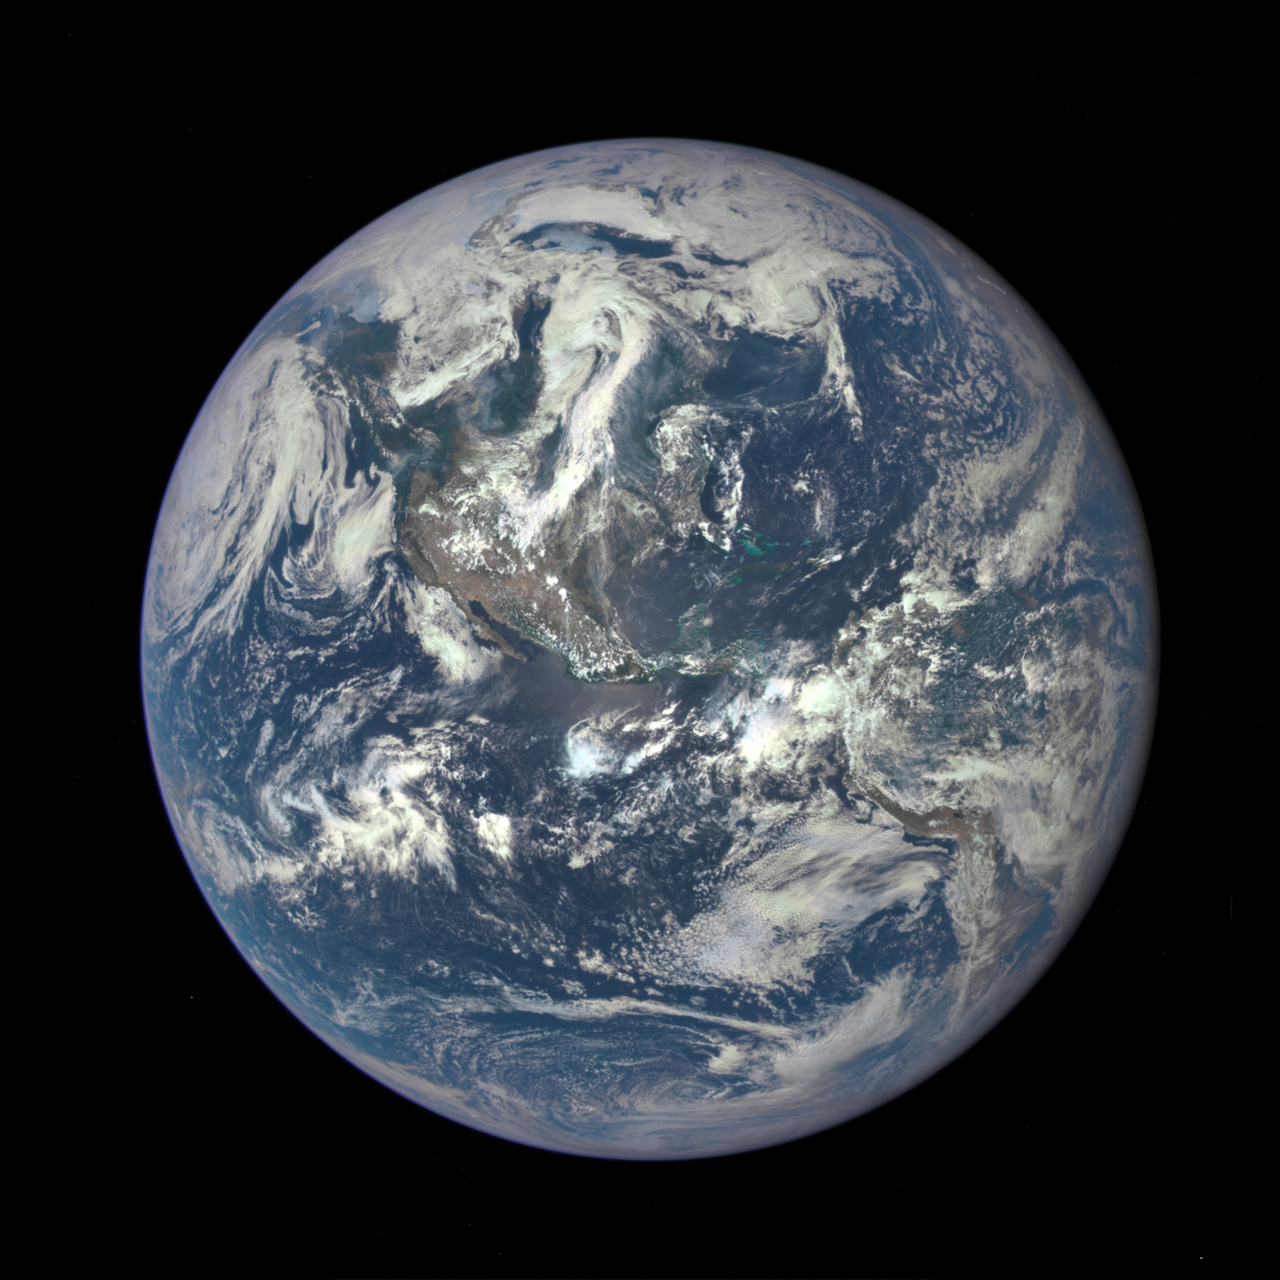
Climate • NASA public domain
NASA/DSCOVR EPIC, Earth image, 6 July 2015. NASA public domain in the U.S.; credit recommended per NASA image-use guidance. Illustrative Earth image, not a climate-data graphic.

October 20 — U.S. consumer prices
Chart: four seasonally adjusted month-to-month CPI category changes, March–September 2026. September values: gasoline +9.1%, food at home −0.1%, electricity +0.2%, shelter +0.4%. These categories are not an exhaustive consumer basket. The BLS report was released October 14; the chart does not show the annual headline inflation rate.
October 21 — EU battery-electric cars
Chart: annual new passenger-car registrations of battery-electric vehicles in the EU27, 2013–2025, number of registrations. It excludes plug-in hybrids; the annual series has no 2026 value. 2025: 1,888,016; 2013: 22,066. Values come from Eurostat’s road_eqr_carpda table.
- Eurostat dataset browser: road_eqr_carpda
- Eurostat, new passenger-car registrations by fuel type (31 Jul 2026)
The chart’s EU flag marker is served from FlagCDN, Flagpedia’s CDN. Flagpedia states that its flag images are public domain and free for commercial and non-commercial use, and that the images are based on Wikimedia Commons vectors; see its download/CDN terms and Terms of Use. The EU’s official emblem guidance permits third-party use provided it does not imply a connection, support, sponsorship or approval that does not exist. Here the flag is only a region marker; it does not indicate EU sponsorship.
October 22 — Apple net sales mix
Chart: Apple’s annual net sales by five reported categories in fiscal years 2021–2025, nominal USD billions; not profit or units. FY2023 covered 53 weeks; other years in the comparison covered 52. Category definitions/assortment can evolve. Apple’s October 15 iPhone Duo update is news context only; the chart ends in FY2025 and implies no launch effect.
- Apple FY2022 consolidated statements (FY2021 and FY2022 category data)
- Apple FY2023 consolidated statements
- Apple FY2025 consolidated statements (FY2024 and FY2025 category data)
- Apple iPhone Duo update (15 Oct 2026)
The five pictograms are simple original ChartGlow graphics. The photo shows historical Apple devices from 2017; it does not depict a product in the 2026 release.
October 23 — men’s half-marathon marks
Chart: selected record marks shown as “Seconds saved” against the 57:30 baseline by Yomif Kejelcha in Valencia on 27 October 2024 (ratified): seconds saved = 3,450 − recorded time in seconds. The three observations are 0 seconds (57:30, Valencia, 27 Oct 2024; ratified), 10 seconds (57:20, Lisbon, 8 Mar 2026; ratification pending in the World Athletics report), and 39 seconds (56:51, Buenos Aires, 23 Aug 2026; pending in the report). Only these three observed marks are plotted; no intermediate records are added. Any in-between animation/interpolation is visual movement only, not evidence of records at those times. Raw times, dates, venues and ratification status remain in the source data. This is not the complete record history.
- World Athletics: Kejelcha’s 57:30 record ratified (7 Oct 2025)
- World Athletics: Kiplimo 57:20 in Lisbon (8 Mar 2026; ratification pending)
- World Athletics: Kejelcha 56:51 in Buenos Aires (23 Aug 2026; ratification pending)
The timer emoji used as the chart icon is Twemoji, licensed CC BY 4.0. It is a symbol, not event photography.
October 24 — renewable power capacity
Chart: year-end installed power capacity for four IRENA technology groups (renewable hydropower, solar, wind and bioenergy), 2015–2025, GW. This is capacity, not electricity generation; geothermal and marine are excluded, so the four categories are not the complete renewable total. No projection values are included.
- IRENASTAT: Electricity statistics by Region, Technology, Data Type and Year
- IRENA, Renewable Capacity Statistics 2026
- IRENA WETO 2026 listing and October 2026 updates
- IRENA 32nd Council update (14 Oct 2026; official listing)
IRENA identifies its source publication as Renewable Energy Statistics 2026. The October WETO is contextual news only; its scenario values are not plotted. The solar photo is illustrative and not an asset in the IRENA dataset.
October 25 — September global temperature
Chart: September global ERA5 surface-air-temperature anomalies, 1980–2026, °C relative to 1850–1900. September 1980: +0.4429°C; September 2026: +1.6340°C. Copernicus reported September 2026 as the second warmest September in ERA5. One monthly value above 1.5°C is not the Paris Agreement’s long-term temperature-limit assessment.
- Copernicus Climate Change Service, September 2026 bulletin (12 Oct 2026)
- C3S climate-bulletin data and analysis notes
- Copernicus Climate Data Store, ERA5 monthly means
Earth image credit: NASA/DSCOVR EPIC, 6 July 2015; public domain in the U.S. The image shows the sunlit Earth, not temperature anomalies or the 2026 climate.
Illustration icon credits
Where category symbols are used in the CPI, sport or climate chart, they are Twemoji graphics, CC BY 4.0: gasoline pump, shopping cart, light bulb, house, stopwatch and globe (as applicable). Credit: “Twemoji contributors / CC BY 4.0.” See the license. Icons are resized as series markers; their artwork is unchanged. These icons represent categories; they are not BLS photos or race images. Apple’s five chart pictograms and IRENA’s technology pictograms are original geometric graphics made for ChartGlow.
Credit rule for each photo: keep the named creator, Commons item-page link, and license link with the post or its source page. For these videos, the photos are resized, positioned and shown with adjusted opacity; framing may crop their edges. No AI image generation was used. Do not imply endorsement by Apple, a vehicle maker, Co-op, Instavolt, IRENA, NASA, or the depicted facilities.