Practical guide · Console history
Make an animated Line chart with console history
Trace six gaming hardware families from Game Boy to PS5. Build a Line chart from the existing data, or keep the finished composition and photos. No AI generation is needed.
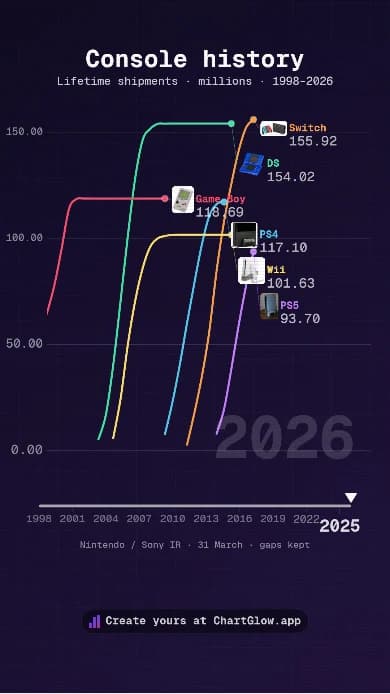
1. Choose one starting point
Open the console-history dataset and choose Use this dataset. It creates a separate chart with the supplied data and a starter style. The complete project keeps the saved Line chart, console photos, styling and portrait layout; choose Use this project there instead if you want that composition.
Sign in and confirm your email if asked, then return to the same item and choose its Use button. Signing in alone does not create a chart. Your existing work stays intact. Free accounts allow 5 saved projects; at the limit, you can keep editing an existing chart. Free exports include the ChartGlow watermark.
2. Map the data — keep cumulative totals once
Open Data to inspect 78 observations for Game Boy, DS, Wii, PS4, Switch and PS5. In Columns, keep these mappings:
- Entity → Console: the hardware family.
- Time → Year: the observation date, ordered ascending.
- Value → Sales: lifetime worldwide hardware shipments, in millions.
- Series Image → Image: the supplied console photo, not a country flag.
Choose Line in chart settings. Keep Cumulative Sum OFF: Sales already contains lifetime totals. Adding them again would count the same units repeatedly. Keep Fill Missing Values OFF. Annual, Basis and Observed are context columns; do not add them to Sales or map them as extra values.
These are manufacturer hardware shipments worldwide (sell-in), not annual retail sales or individual players. Nintendo figures are reconstructed from published lifetime and annual/grouped values; Sony totals sum rounded annual figures. Preserve the supplied precision and source notes.
3. Keep the timeline and photos honest
Game Boy starts at 64.42 million in 1998, not zero. It was already on sale before the first observation. Do not invent an earlier trajectory. The six families have different launch dates and reporting windows; this is selected history, not an equal-age comparison or an exhaustive console ranking.
Observations use 31 March fiscal-year-end dates, with different last reports: Game Boy 2014, PS4 2022, DS and Wii 2023, and Switch and PS5 through 2026. A finished historical line remains visible, but stops at its last reported date. Missing periods are gaps, never zero; do not extend an older console to 2026. Movement between observations is visual interpolation, not extra observations.
For a fresh layout, choose Portrait (9:16) and Platform Safe Zones → Universal. The complete project already keeps its accepted composition. Keep photos and source credits, and label the value axis as millions of lifetime hardware shipments.
Play Preview at desktop and phone size. Check title, subtitle, dates, units, console names and photos together at the beginning, middle and end. Around crossings, watch before, during and after: labels should recover their readability. Wait for Saved, reload the same chart and check your changes. See how to read racing charts.
4. Export and open your MP4
Open Export in the editor header. Choose Format → MP4, then an available Resolution and Smoothness: 720p or 1080p, 30 or 60 FPS. Portrait 1080p is 1080 × 1920 pixels; encoding depends on your browser and device.
Choose Start Export and keep the tab open. Open the downloaded file and check the beginning, crossings and end at phone size. A completion message alone does not confirm a readable video. Export downloads a file; it does not publish a social post. Use the social-video export guide for more detail, or watch the existing console-history MP4 without creating another chart.
Sources and limits to keep with your chart
The existing selection covers 31 March 1998–2026 with independent windows. Game Boy includes Color; DS includes its variants; Switch includes original, Lite and OLED, excluding Switch 2. Handheld and home-console families are mixed explicitly. PS1/PS2 factory production shipments and partial PS3/Xbox 360 history are excluded rather than presented as comparable lifetime totals.
Nintendo reconstruction retains rounded annual and grouped-period entries; Sony annual data is rounded to 0.1 million. For example, the supplied PS4 sum of 117.1 million differs from Sony’s rounded official lower bound of 117.0 million. Keep those definitions; do not replace a missing value with zero or imply exact daily counts.
- Nintendo IR historical data and Sony Interactive Entertainment Business Data & Sales.
- Console photos: Evan-Amos, public domain (Game Boy, DS, Wii, PS4, Switch); Howardcorn33, CC0 1.0 (PS5). Retain individual image links and manufacturer attribution from the source record.
- Saved source, transformation and image-rights record.