Practical guide · Chart to MP4
Prepare and export a readable chart video for social media
Make the names, numbers, flags, and source readable at phone size. Prepare the chart in the native editor, check Preview, then open the actual exported file before sharing it.
This guide uses existing ChartGlow controls and accepted examples. Export creates a file in your browser; it does not publish to a social account. Free exports include the ChartGlow watermark.
1. Start with verified data and keep your project
Keep the source, unit, dates, selected entities, and any rounding beside the data. Unknown is not zero. Bar highlights a changing ranking; Line follows trajectories. See the guide to units, rankings, and interpolation before choosing the story.
To use an existing example’s CSV, open New chart, sign in if asked, and choose Upload a file. This creates a new project; it does not clone a finished example. Set Entity Column, Time Column or Order Source, and Value / Metric Column in Fields. On mobile, open Open chart settings → Fields.
2. Choose the format, then apply Universal
- In Chart, choose Chart Type and Format. Portrait is 9:16; Feed is 4:5. Choose your Design theme before final positioning.
- After these choices, use Chart → Platform Safe Zones → Universal. The panel appears for Portrait and Feed, not Square or Landscape. Changing type or format can reset layout positions: reapply Universal after a later change.
- Check the title, subtitle, source, timeline, and ticker in Preview. Universal sets their vertical positions and the chart’s top/bottom margins; it does not fix long text or side clipping. Adjust Labels and Design where necessary, then check again.
Compatible presets describes the current layout; it is not proof that it was saved. Custom layout means no preset matches your current positions and margins. Universal is a starting layout, not a guarantee against every platform’s overlays or captions. Check the intended viewing format.
3. Associate the right flags or images
For countries, use Data → Tools → Add country flags to open Auto Flags. Choose the country-name column, review every association, then select the resulting flag column in Fields → Floating Image Source and Flag Pattern Source. A normal file import does not automatically add flags. Resolve ambiguous names against your source.
For other entities, use relevant image URLs in a column associated with Fields → Floating Image Source. In Design, check Floating Icon / Logo and the image shape: a circle may crop a rectangular flag or logo. Keep each association consistent across periods, and check that every image loads after reload.
An image URL or search result is not a licence. Keep its source page, creator, licence, and required attribution. The accepted country examples credit Flagcdn / Flagpedia public-domain flags; their linked recipes retain the data sources and licences. Recheck rights for your own assets.
4. Give the viewer time and space to read
- Use a short chart title, explicit unit, readable source credit, and sensible decimals. The project name in the header is separate from the chart title. Adjust element Size/Position in Labels and label/value sizes in Design; judge the result at phone size without zoom.
- Choose contrast that keeps names, numbers, and images visible throughout the animation. In Chart, Max Items limits the displayed ranking, not the imported table. A smaller, clearly disclosed selection can help a dense chart; keep the data and interpretation honest.
- For Bar only, compare Chart → Dynamic Bar Height off and on with the same data, theme, ratio, and Max Items. It adapts and smooths vertical spacing as the visible count changes; it does not change values or ranks. Keep the setting that reads better without clipping or excessive vertical movement, and check it in the final MP4. Line has no Dynamic Bar Height option.
- In Continuous, Chart Duration controls the chart sequence. A short sequence is useful only if the viewer can read it. The optional intro, final hold, and caption pauses add time; in Pulse, hold, transition, and step settings determine the sequence. Check the total duration shown under Preview and in the received file.
5. Review Preview, then confirm the saved project
On desktop and at phone size, use Play preview, Pause preview, Restart preview, and Video timeline beneath the canvas. Review the beginning, middle, end, densest scene, and any changes of rank. Read names, values, flags, title, and source at normal playback speed.
Wait for Saved before reloading the same project. On mobile, the save status appears beneath the project name and header controls. If Save failed appears, keep the tab open, use Retry, and confirm Saved before leaving. After reload, check the data, mappings, assets, Universal positions/margins, and chosen Dynamic Bar Height setting. Reload clears the session’s Undo/Redo history.
6. Export through ChartGlow’s MP4 dialogue
- Open Export in the editor header; on mobile, use the Export chart icon in that header. Set Format → MP4.
- Choose Quality and Smoothness. MP4 offers 720p or 1080p and 30 or 60 FPS. For Portrait, 720p is 720×1280 and 1080p is 1080×1920; for Feed they are 720×900 and 1080×1350. Start with 720p / 30 FPS if it reads clearly, or choose more detail when needed. The quality selector does not impose a premium lock; encoding still depends on browser support and device performance.
- Free exports keep the native watermark; removing it is a Premium feature. Preserve it on a free account. GIF is a separate format with reduced dimensions and 15/30 FPS; it is not the MP4 workflow described here.
- Choose Start Export, keep the tab open, and check your downloads. Rendering and image loading can take time. Export Successful! or a progress screen alone is not evidence of a usable file. If interrupted, check for an existing complete download before starting another export.
This dialogue adds no audio and exposes no custom bitrate or maximum-file-size control. Social-title suggestions use AI credits as shown in the product; they are optional and do not publish anything. Upload your checked file through the destination’s own workflow.
7. Open the received MP4 and inspect the motion
Open the actual native MP4 in a video player, play it to the end, and test pause and seek. Check duration, dimensions, watermark, text, values, source credit, and assets at phone size. Preview and MP4 must both read clearly.
Brief crossing: check recovery
Bars or lines can cross and overlap briefly when ranks change. Look just before, during, and after the passage, then play that segment normally. If names and values regain readability and motion stays coherent, the crossing is normal. One paused frame does not establish a defect.
Persistent problem: hold the file
If text stays unreadable, an element clips or disappears abnormally, or movement is erratic, replay the segment to confirm the problem. Record the start/end times and affected elements in both Preview and MP4. Preserve the project and file while investigating. If only one view fails, keep both as evidence. Do not hide bars/images or reduce their opacity to avoid crossings.
Use an accepted example as your reference
These existing native examples include source notes, country flags, and exact CSVs. They are references for preparing your own chart, not an automatic template import or a guarantee for every future configuration.
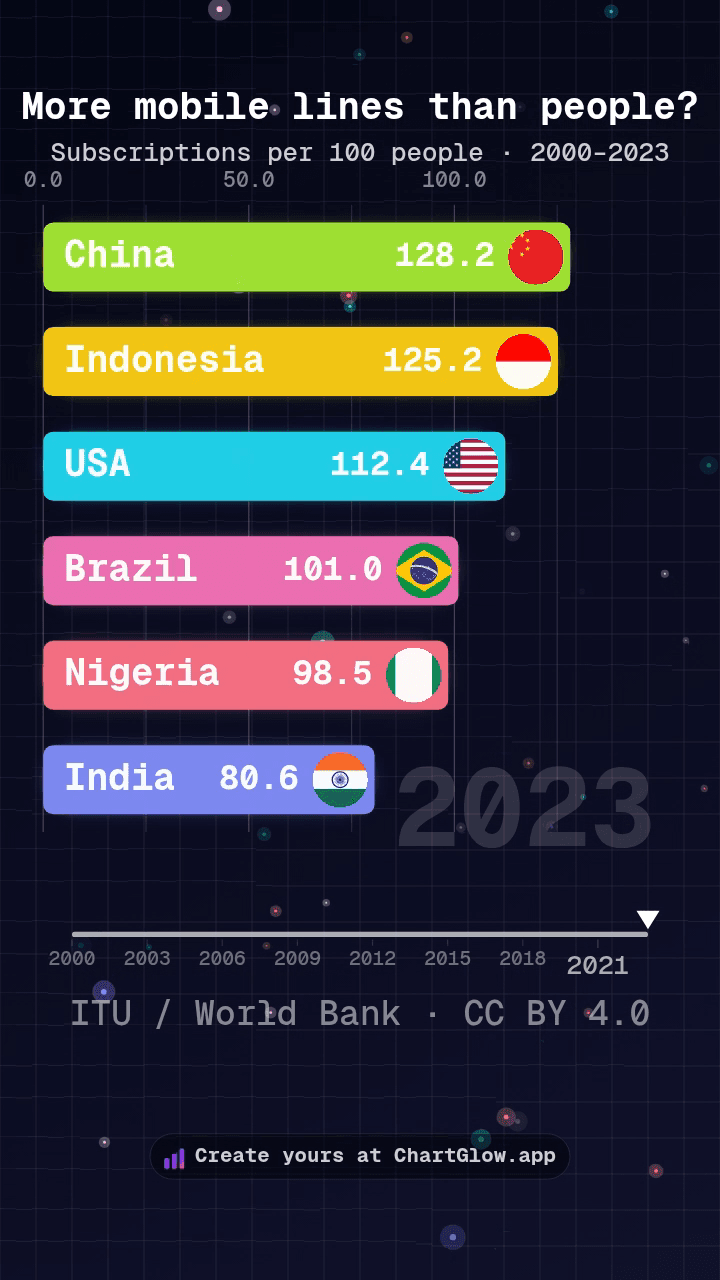
Bar: mobile subscriptions
Compare a changing ranking in six selected countries. Subscriptions per 100 people are not unique users.
Watch the example & read its recipe →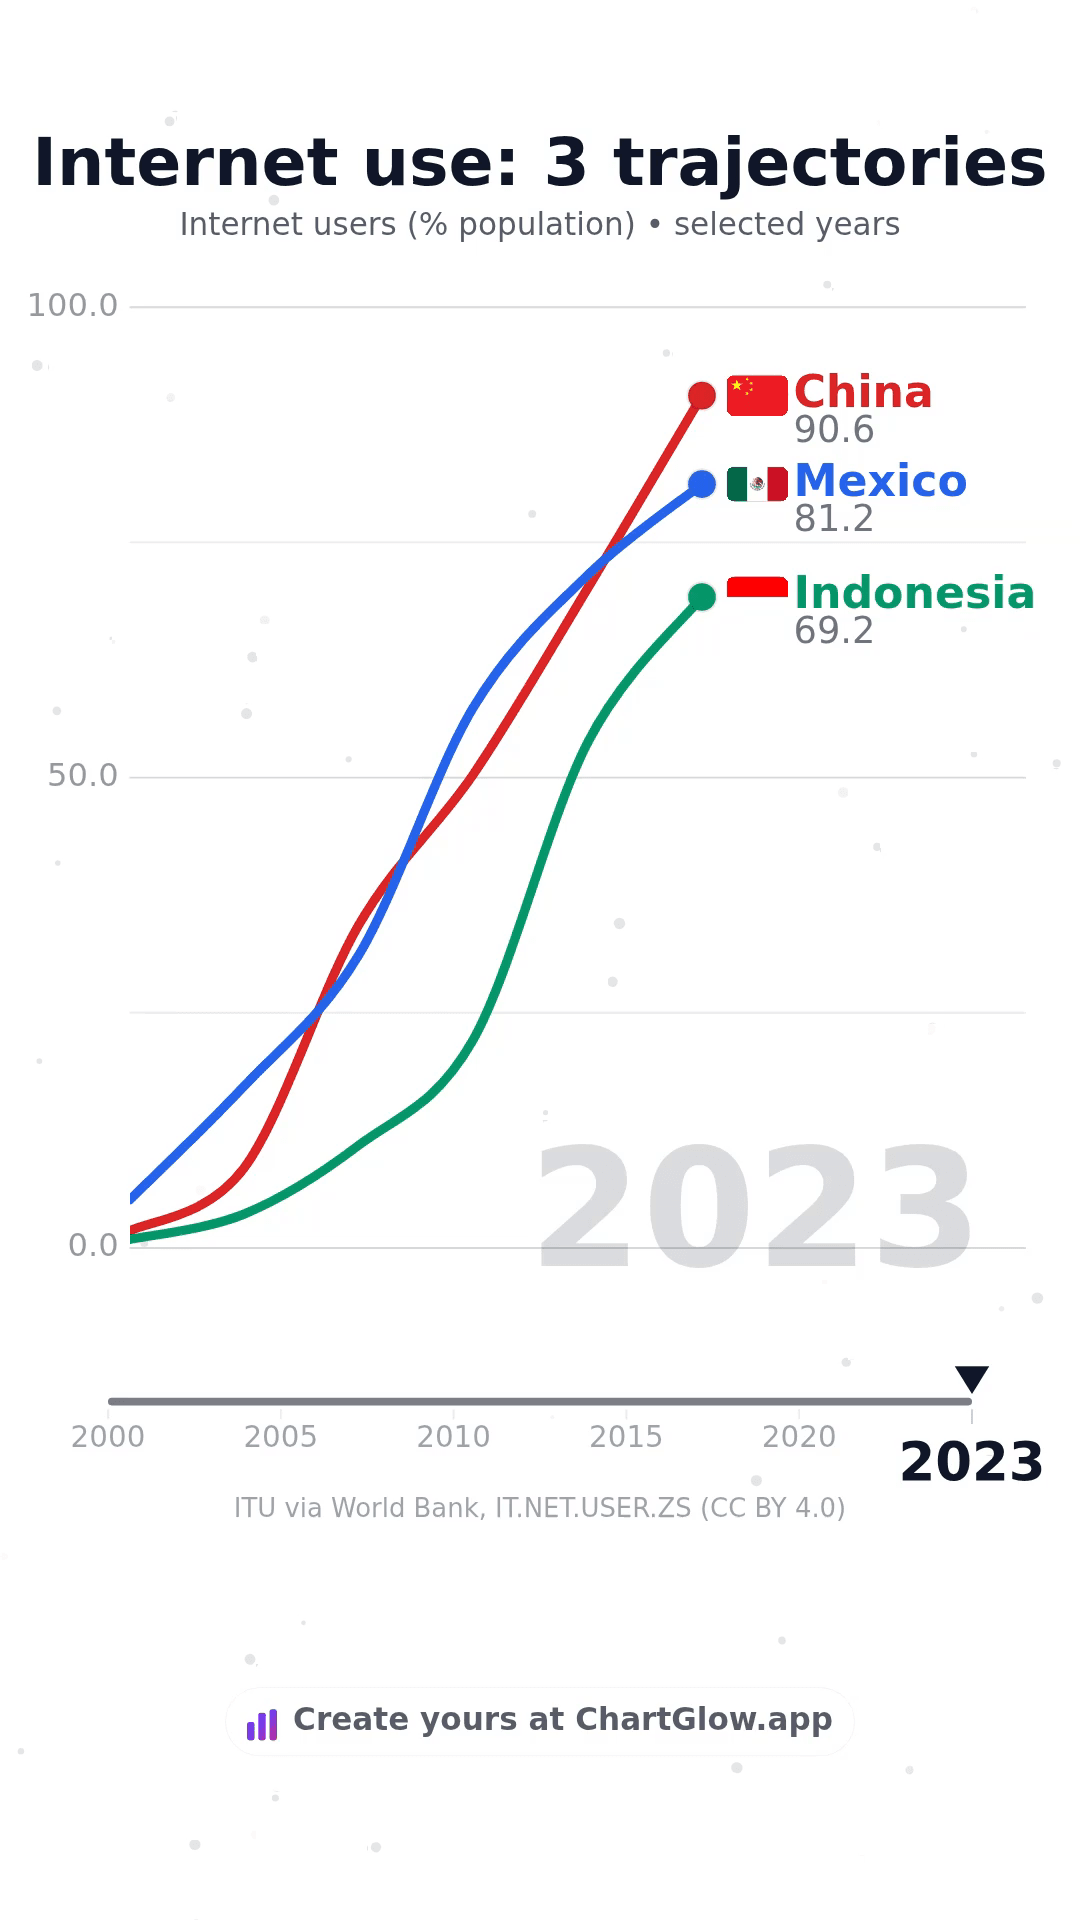
Line: internet use
Follow three countries across six selected dates. Interpolated motion does not create extra observations.
Watch the example & read its recipe →