Practical guide · EU electric cars
Read EU electric-car registrations with a Line chart
Reuse the complete portrait Line project to explore 13 years of new battery-electric car registrations in the EU27. No file import is needed.
1. Start with the complete project
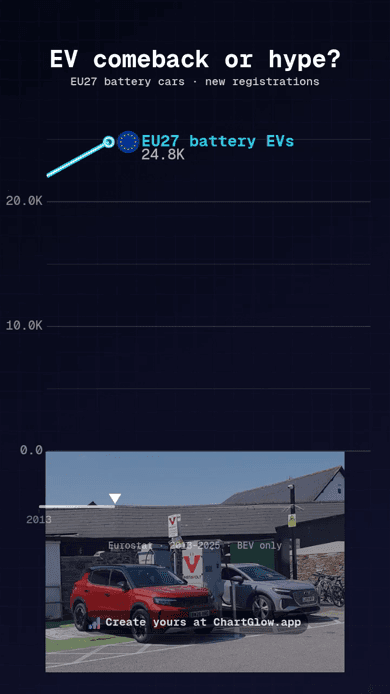
Open the complete EU electric-car project and choose Use this project. Your separate copy keeps the native Line chart, portrait Neon composition, charging-point photo and separate EU flag marker. Sign in if asked, then return to the same project and choose its Use button.
Customize the title or styling, preview your changes and wait for Saved before reloading. Check the title, years, units and values at phone size. Keep the Eurostat credit and let moving labels settle between yearly points.
For a fresh style, the EU electric-car dataset provides the same data in a native Line starter. Its CSV download is optional; you do not need to import a file or rebuild the composition. Both paths preserve your existing work. Free accounts allow 5 saved projects; Free exports keep the ChartGlow watermark.
2. Read annual registrations
The 13 annual observations, 2013–2025, count newly registered battery-electric passenger cars in the EU27. The unit is number of registrations. BEV means battery-electric vehicle; hybrids, including plug-in hybrids, are excluded. The geography is Eurostat’s EU27_2020 aggregate, not all of Europe.
The saved series goes from 22,066 registrations in 2013 to 1,888,016 in 2025. It falls from 1,547,676 in 2023 to 1,455,122 in 2024 before rising in 2025. A lower yearly count means fewer new registrations that year; it does not mean the total vehicle fleet shrank.
These are annual counts, not the vehicle fleet, cumulative registrations or market share. Market share would also require total registrations for the same scope and year. Keep Cumulative Sum OFF to retain the annual measure. No 2026 value or partial-year EAFO figure is included. The counts alone do not explain causes or predict future adoption.
Between yearly points, movement is visual interpolation, not extra observations. The existing mapping is Series → Entity, Year → Time, Registrations → Value and Image → Series Image. Compact labels abbreviate the counts; the underlying data retain the exact integers.
3. Keep the source and credits
- Data: Eurostat road_eqr_carpda, extracted 18 October 2026, with freq=A, unit=NR, mot_nrg=ELC and geo=EU27_2020. This is a saved extraction, not a live feed; later releases may differ. Retain attribution under Eurostat’s reuse policy.
- Background: Mutney, Electric car charging point, Wadebridge, Cornwall — August 2026, photographed 15 August 2026, CC BY 4.0, scaled and positioned in the chart. The Cornwall, UK photo is illustrative, not an EU27 sample or a market measurement.
- Separate EU flag: FlagCDN / Flagpedia, used only as a region marker. Its image terms and the EU’s emblem guidance are linked in the saved source and image-rights record. No EU support, sponsorship or endorsement is implied.


To make your own video, use the editor’s Export button and follow the MP4 export guide. You can also watch the existing electric-car MP4 without creating another chart.