Practical guide · Moon discoveries
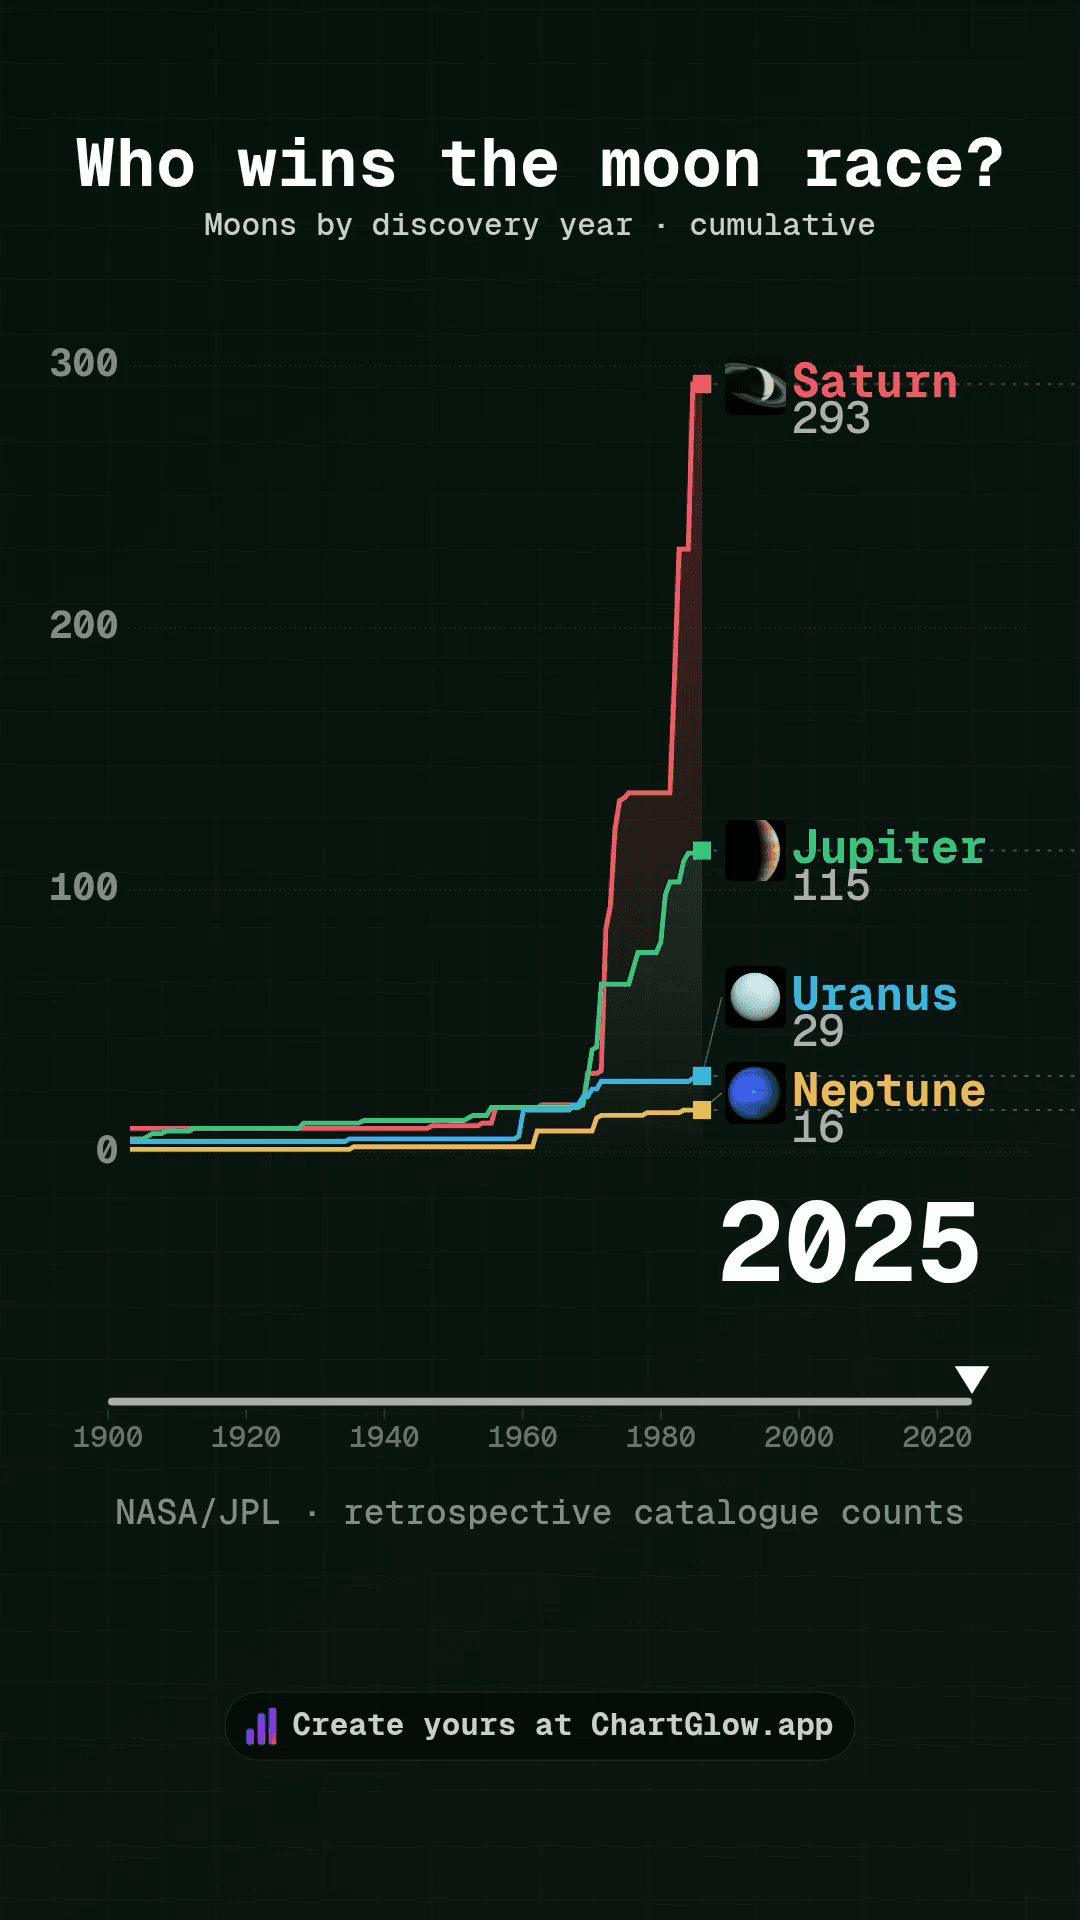
Make an animated Line chart with moon discoveries
Turn the existing moon counts for Jupiter, Saturn, Uranus and Neptune into a Line chart. Start with the data or keep the complete portrait composition. No AI generation is needed.
1. Choose one starting point
Open the moon-discovery dataset and choose Use this dataset. It creates a separate chart with the supplied data and a starter style. The complete project keeps the saved Line chart, planet images, styling and portrait layout; choose Use this project there instead if you want that composition.
Sign in and confirm your email if asked, then return to the same item and choose its Use button. Signing in alone does not create a chart. Your existing work stays intact. Free accounts allow 5 saved projects; at the limit, you can keep editing an existing chart. Free exports include the ChartGlow watermark.
2. Map the columns — count each moon once
In Data, review the 504 observations: four planets for each year from 1900 to 2025. In Columns, keep:
- Entity → Planet: Jupiter, Saturn, Uranus or Neptune.
- Time → Year: years ordered ascending.
- Value → Moons: the already cumulative count.
- Series Image → Image: the supplied NASA planet image.
Choose Line in chart settings. Keep Cumulative Sum OFF: Moons already counts discoveries up to each year. Summing those totals again would count the same moons repeatedly. Keep Fill Missing Values OFF; a missing value must never become a zero.
3. Read the timeline honestly
This is a retrospective reconstruction of the current JPL satellite discovery catalogue, retrieved 18 October 2026. Each currently catalogued moon counts once at its earliest listed discovery year. It is not a history of confirmations or what was officially known at each date.
The 1900 baseline includes earlier discoveries: Jupiter 5, Saturn 9, Uranus 4 and Neptune 1. Keep these starting values rather than resetting them to zero. The 2025 totals are Jupiter 115, Saturn 293, Uranus 29 and Neptune 16. These are four selected giant planets, not a ranking of every Solar System body.
Movement between annual points is visual interpolation, not extra observations. A smooth fractional value during playback is not a fractional moon or an exact discovery date. Keep the discovery-year definition and source note visible.
For a fresh layout, choose Portrait (9:16) and Platform Safe Zones → Universal. The complete project already keeps its saved composition. Retain the planet images and credits, and label the value axis as cumulative moon counts.
Play Preview at desktop and phone size. Check title, subtitle, years, units, planet names and images at the beginning, middle and end. Watch crossings before, during and after the transition so labels have time to recover. Wait for Saved, reload the same chart and check your changes. See how to read racing charts.
4. Export and open your MP4
Open Export in the editor header. Choose Format → MP4, then an available Resolution and Smoothness: 720p or 1080p, 30 or 60 FPS. Portrait 1080p is 1080 × 1920 pixels; encoding depends on your browser and device.
Choose Start Export and keep the tab open. Open the downloaded file and check the beginning, crossings and end at phone size. A completion message alone does not confirm a readable video. Export downloads a file; it does not publish a social post. Use the social-video export guide for more detail, or watch the existing moon-discovery MP4 without creating another chart.
Keep the sources and image credits
- Data: JPL Solar System Dynamics satellite discovery catalogue. Preserve its discovery references and the retrospective method; the saved snapshot does not update automatically.
- Images: Jupiter and Neptune — NASA/JPL; Saturn — NASA/JPL/USGS; Uranus — NASA/JPL-Caltech. Retain the individual image records and credits; follow the JPL Image Use Policy. No NASA/JPL endorsement is implied.
- Saved source, method and image-rights record.