Practical guide · Half-marathon
Read half-marathon gains with a Line chart
Reuse the complete portrait Line project to compare three selected half-marathon performances. See how 57:30 becomes the baseline for seconds saved. No file import is needed.
1. Start with the complete project
Open the complete half-marathon project and choose Use this project. Your separate copy keeps the native Line chart, portrait composition, illustrative indoor-track photo and separate stopwatch marker. Sign in if asked, then return to the same project and choose its Use button.
Customize the title or styling, preview your changes and wait for Saved before reloading. At phone size, check the dates, seconds-saved label, values and World Athletics credit. Keep the image attributions.
For a fresh style, the half-marathon dataset provides the same data in a native Line starter. Its CSV download is optional; you do not need to import a file or rebuild the composition. Both paths preserve your existing work. Free accounts allow 5 saved projects; Free exports keep the ChartGlow watermark.
2. Read seconds saved, not race times
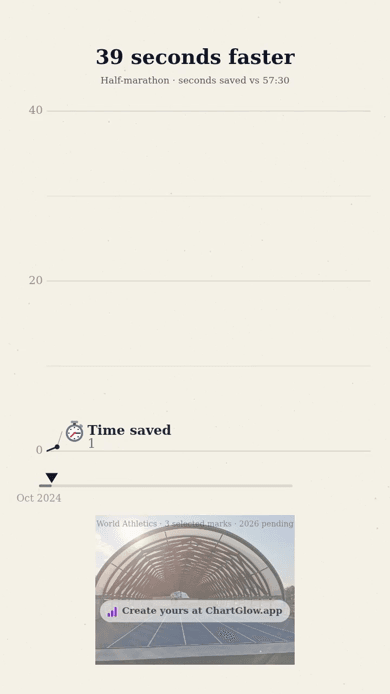
The chart shows three selected men’s half-marathon performances, 2024–2026. Each value is the time saved against 57:30 (3,450 seconds): subtract the observed race time in seconds from 3,450. A higher point means a faster selected performance, not a longer race time.
- 27 October 2024 · Yomif Kejelcha · Valencia · 57:30 (3,450 seconds) → 0 seconds saved.
- 8 March 2026 · Jacob Kiplimo · Lisbon · 57:20 (3,440 seconds) → 10 seconds saved.
- 23 August 2026 · Yomif Kejelcha · Buenos Aires · 56:51 (3,411 seconds) → 39 seconds saved.
The initial zero is the observed baseline, not a missing value. These are selected performances, not an exhaustive record history or a continuous measurement. The 2024 mark was ratified in the cited World Athletics report of 7 October 2025. The two 2026 marks were pending ratification in their cited reports of 8 March and 23 August 2026; current ratification is not asserted.
Keep Cumulative Sum OFF: each gain already compares with the same baseline, so adding gains would change their meaning. Between the three dated points, movement is visual interpolation, not extra observations. It supplies no intermediate records or projections. The existing mapping is Series → Entity, Date → Time, Seconds saved → Value and Image → Series Image. Keep the original dates and values.
3. Keep the source and credits
- Data: World Athletics dated reporting — Kejelcha’s 57:30 ratified, 7 October 2025; Kiplimo’s 57:20, 8 March 2026; Kejelcha’s 56:51, 23 August 2026. Retain attribution, original marks, event dates, athletes, venues and the transformation in the saved source and image-rights record. This is a saved selection, not a live record feed.
- Background: Petewarrior / Wikimedia Commons, Brillia Running Stadium track / CC BY 4.0, resized, positioned and shown with adjusted opacity. This empty 60 m indoor training track is illustrative, not a record-race venue or a photograph of the road races. No endorsement is implied.
- Separate stopwatch marker: Twemoji contributors / CC BY 4.0, resized unchanged artwork. It is a symbolic series marker, separate from the track photograph.

To make your own video, use the editor’s Export button and follow the MP4 export guide. You can also watch the existing half-marathon MP4 without creating another chart.