Practical guide · Renewable power
Make a Bubble chart with renewable power data
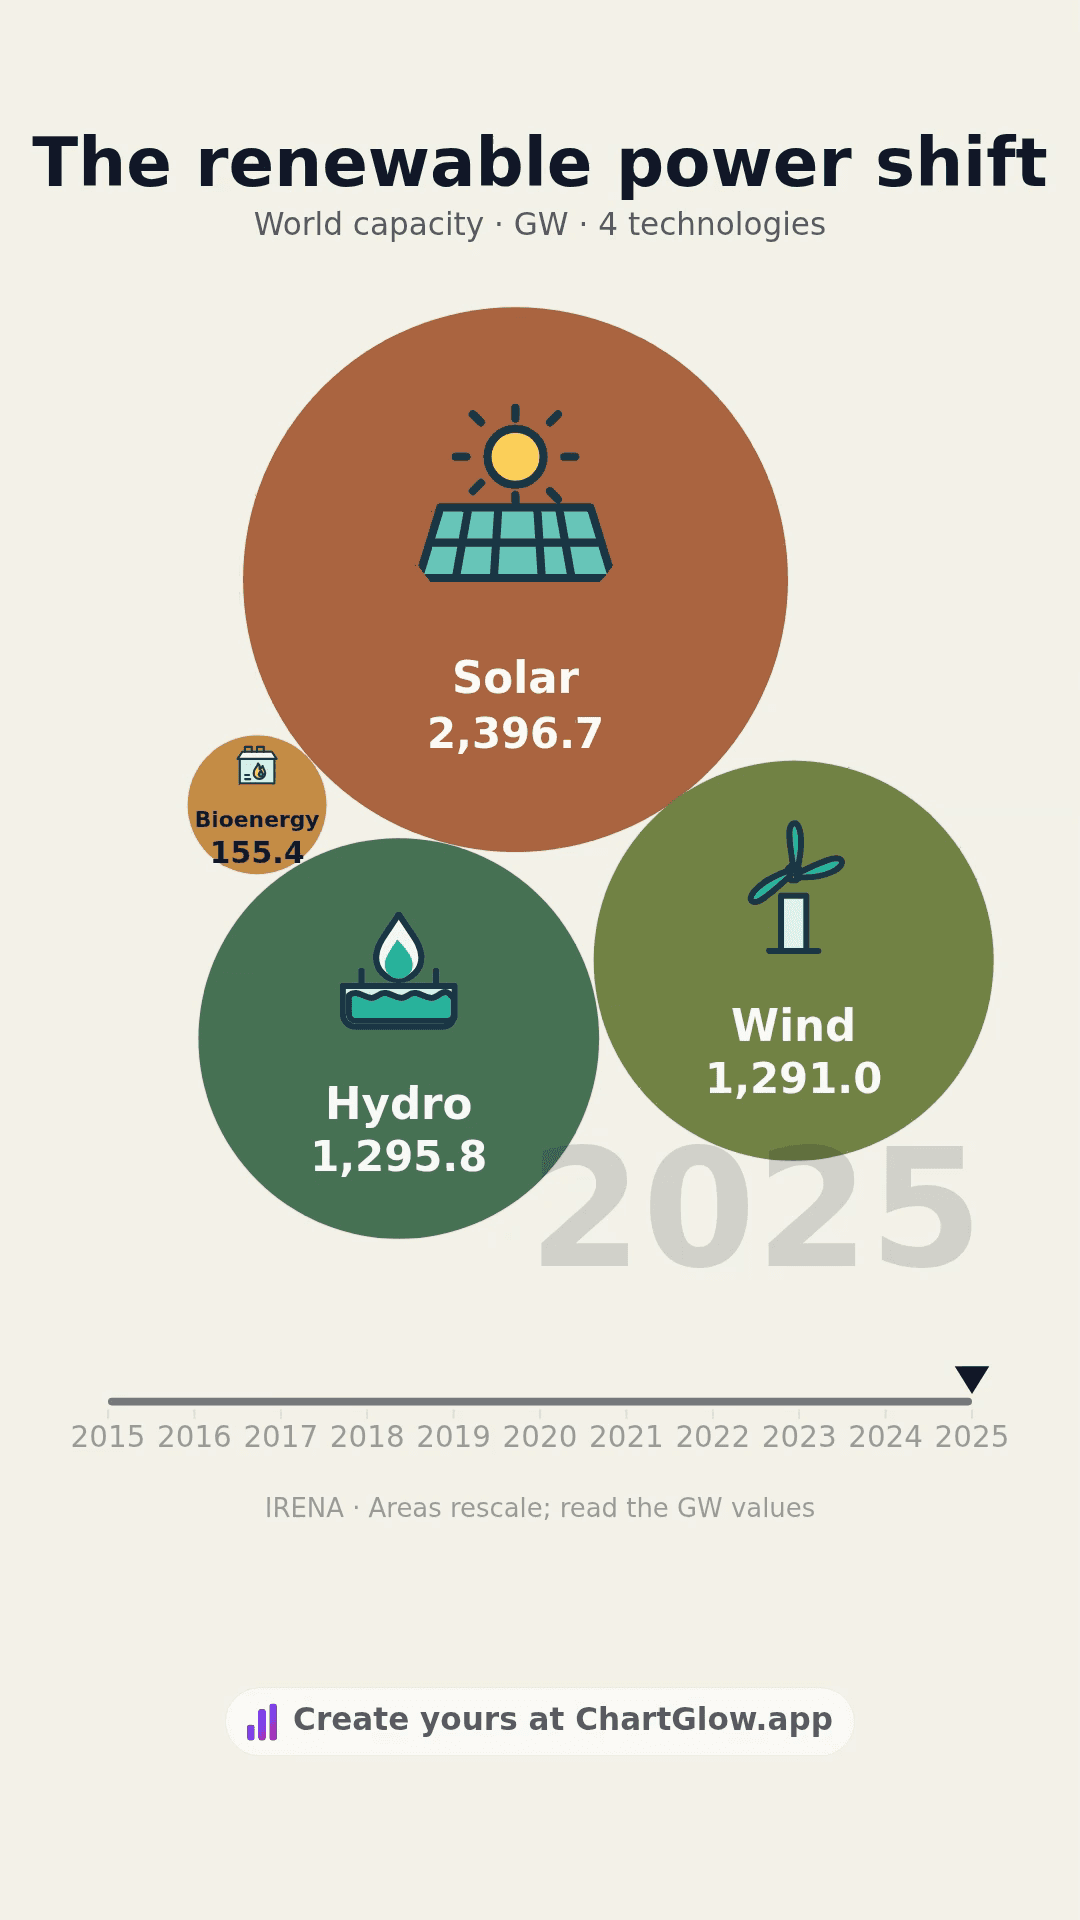
Animate how Hydro, Solar, Wind and Bioenergy changed from 2015 to 2025. Start with the existing data or keep the complete Nature composition and technology images.
1. Choose one starting point
Open the renewable-power dataset and choose Use this dataset. It creates a separate chart with the supplied data and a native Bubble Area starter. The complete project keeps the saved Bubble Area chart, technology images, Nature styling and Universal portrait layout; choose Use this project there instead if you want that composition.
Sign in and confirm your email if asked, then return to the same item and choose its Use button. Signing in alone does not create a chart. Your existing work stays intact. Free accounts allow 5 saved projects; at the limit, you can keep editing an existing chart. Free exports include the ChartGlow watermark.
2. Map the columns — keep each year separate
In Data, review the 44 observations: four technologies for each year from 2015 to 2025. In Columns, keep:
- Entity → name: Hydro, Solar, Wind or Bioenergy.
- Time → year: years ordered ascending.
- Value → value: world year-end installed electrical capacity in GW.
- Series Image → image: the supplied HTTPS technology pictogram.
Choose Bubble in chart settings and keep Area (Default) for size mapping. Both starting points already use Bubble Area. Keep Cumulative Sum OFF: these are annual capacity stocks, not additions to sum across years. Keep Fill Missing Values OFF; an absent observation is not a zero.
3. Read the GW values, then the movement
GW measures installed capacity at the end of each year. It is not electricity generation or annual capacity additions. IRENA source values in MW were divided by 1,000 to obtain GW. This fixed dataset covers Hydro, Solar, Wind and Bioenergy worldwide; geothermal and marine are excluded, not zero. The four technologies are not an exhaustive renewable-energy total.
Bubble Area shows relative sizes within each moment. The chart rescales the areas to fit the available space, with minimum and maximum radii. A bubble can look smaller even while its GW value grows, if other technologies grow faster. Compare the displayed GW values across years, rather than treating the screen area as a fixed GW scale. The bounded radii also limit exact visual ratios.
Bubble positions are arranged for the layout; they do not encode x/y measures as a scatter plot would. Movement between annual points is visual interpolation, not extra observations. Keep the years, GW units and source note visible.
For a fresh layout, choose Portrait (9:16) and Platform Safe Zones → Universal. Use the complete project to retain its Nature theme, saved composition and four original technology pictograms.
Play Preview at desktop and phone size. Check title, subtitle, year, GW values, technology names and images at the beginning, middle and end. Watch transitions long enough to see labels settle. Wait for Saved, reload the same chart and check your changes. See how to read racing charts.
4. Export and open your MP4
Open Export in the editor header. Choose Format → MP4, then an available Resolution and Smoothness: 720p or 1080p, 30 or 60 FPS. Portrait 1080p is 1080 × 1920 pixels; encoding depends on your browser and device.
Choose Start Export and keep the tab open. Open the downloaded file and check the beginning, crossings and end at phone size. A completion message alone does not confirm a readable video. Export downloads a file; it does not publish a social post. Use the social-video export guide for more detail, or watch the existing renewable-power MP4 without creating another chart.
Keep the source and image record
- Data: IRENA (2026), Renewable Energy Statistics 2026, world year-end installed capacity. This is the saved 18 October 2026 snapshot, not a live feed.
- IRENASTAT table metadata marks copyright as No; retain IRENA attribution and the IRENA terms and conditions.
- Images: four original geometric technology pictograms created for ChartGlow, with no third-party photographs, logos or implied endorsement.
- Saved source, method and image-rights record.