Stories in motion.
Watch the chart. Discover the story. Explore the numbers.
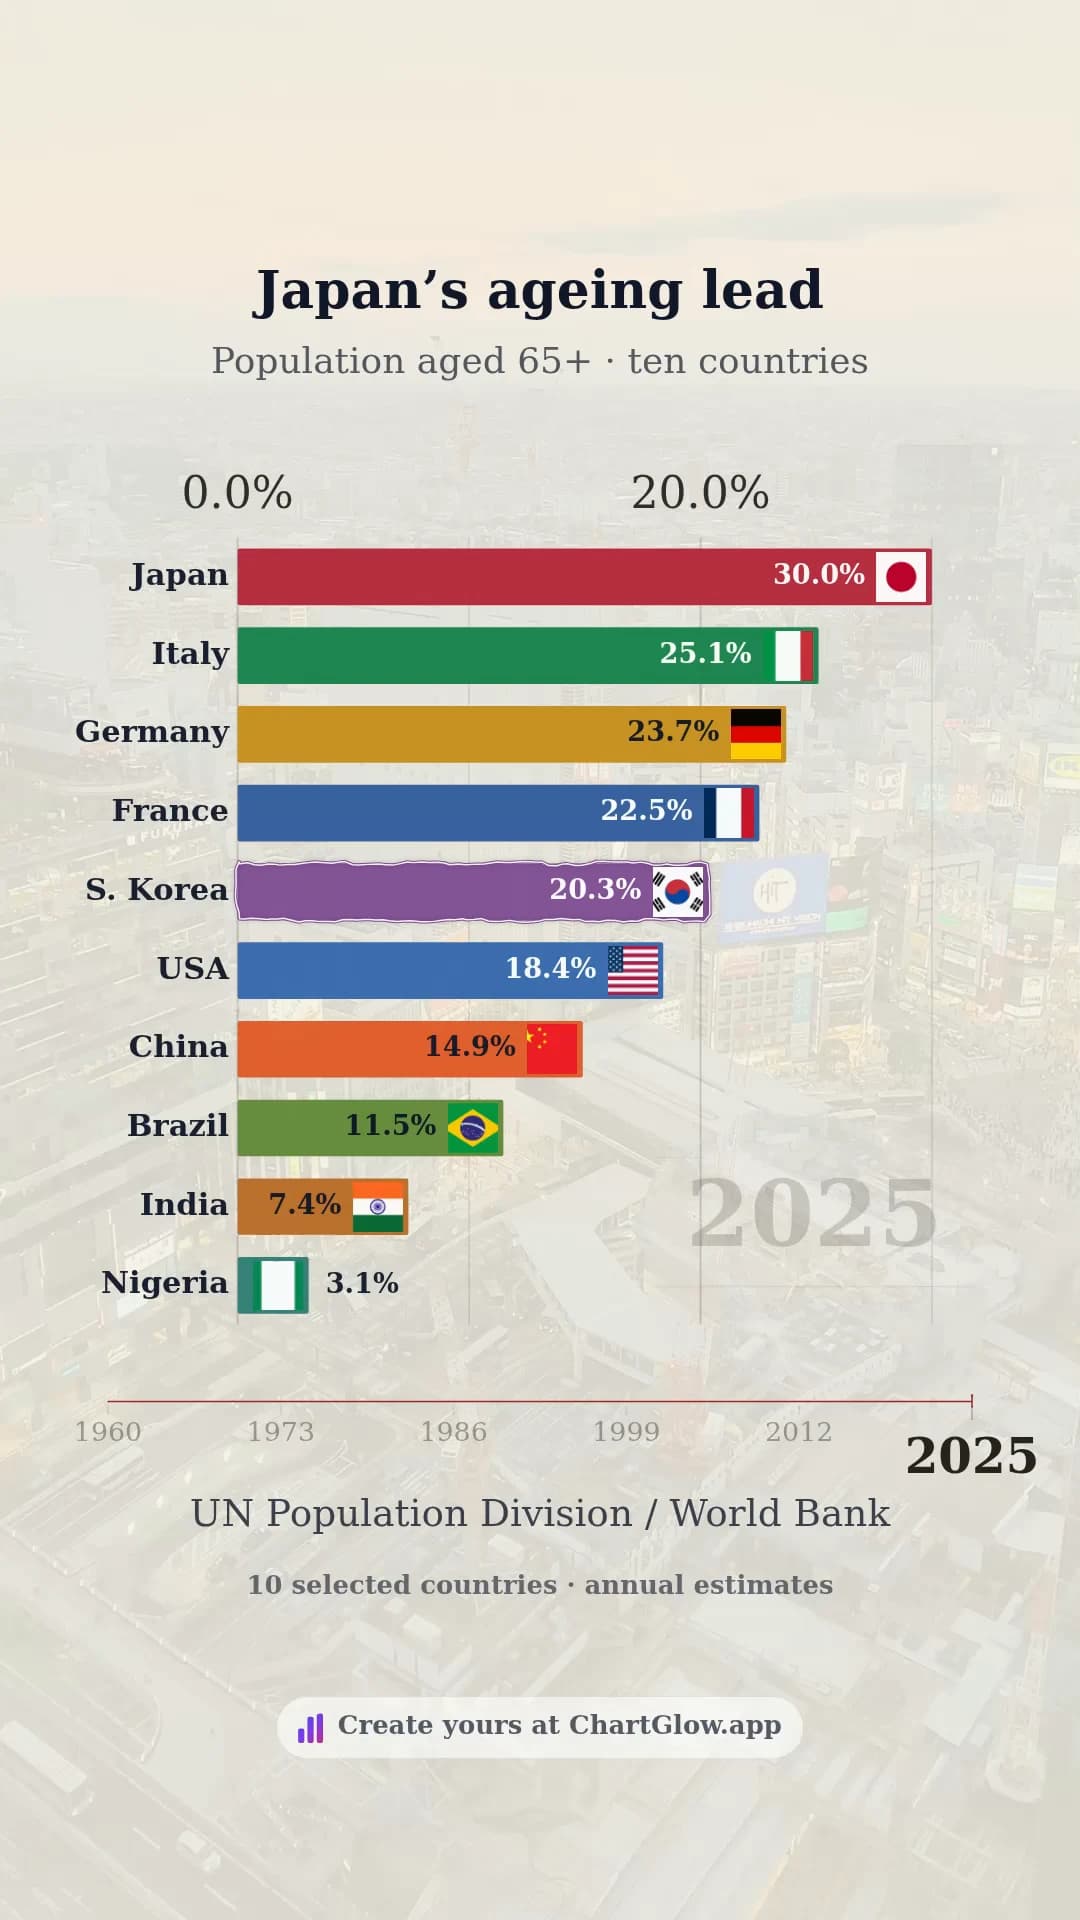
Japan’s ageing lead
Follow the changing share of people aged 65 and above in ten selected countries.
Watch video →
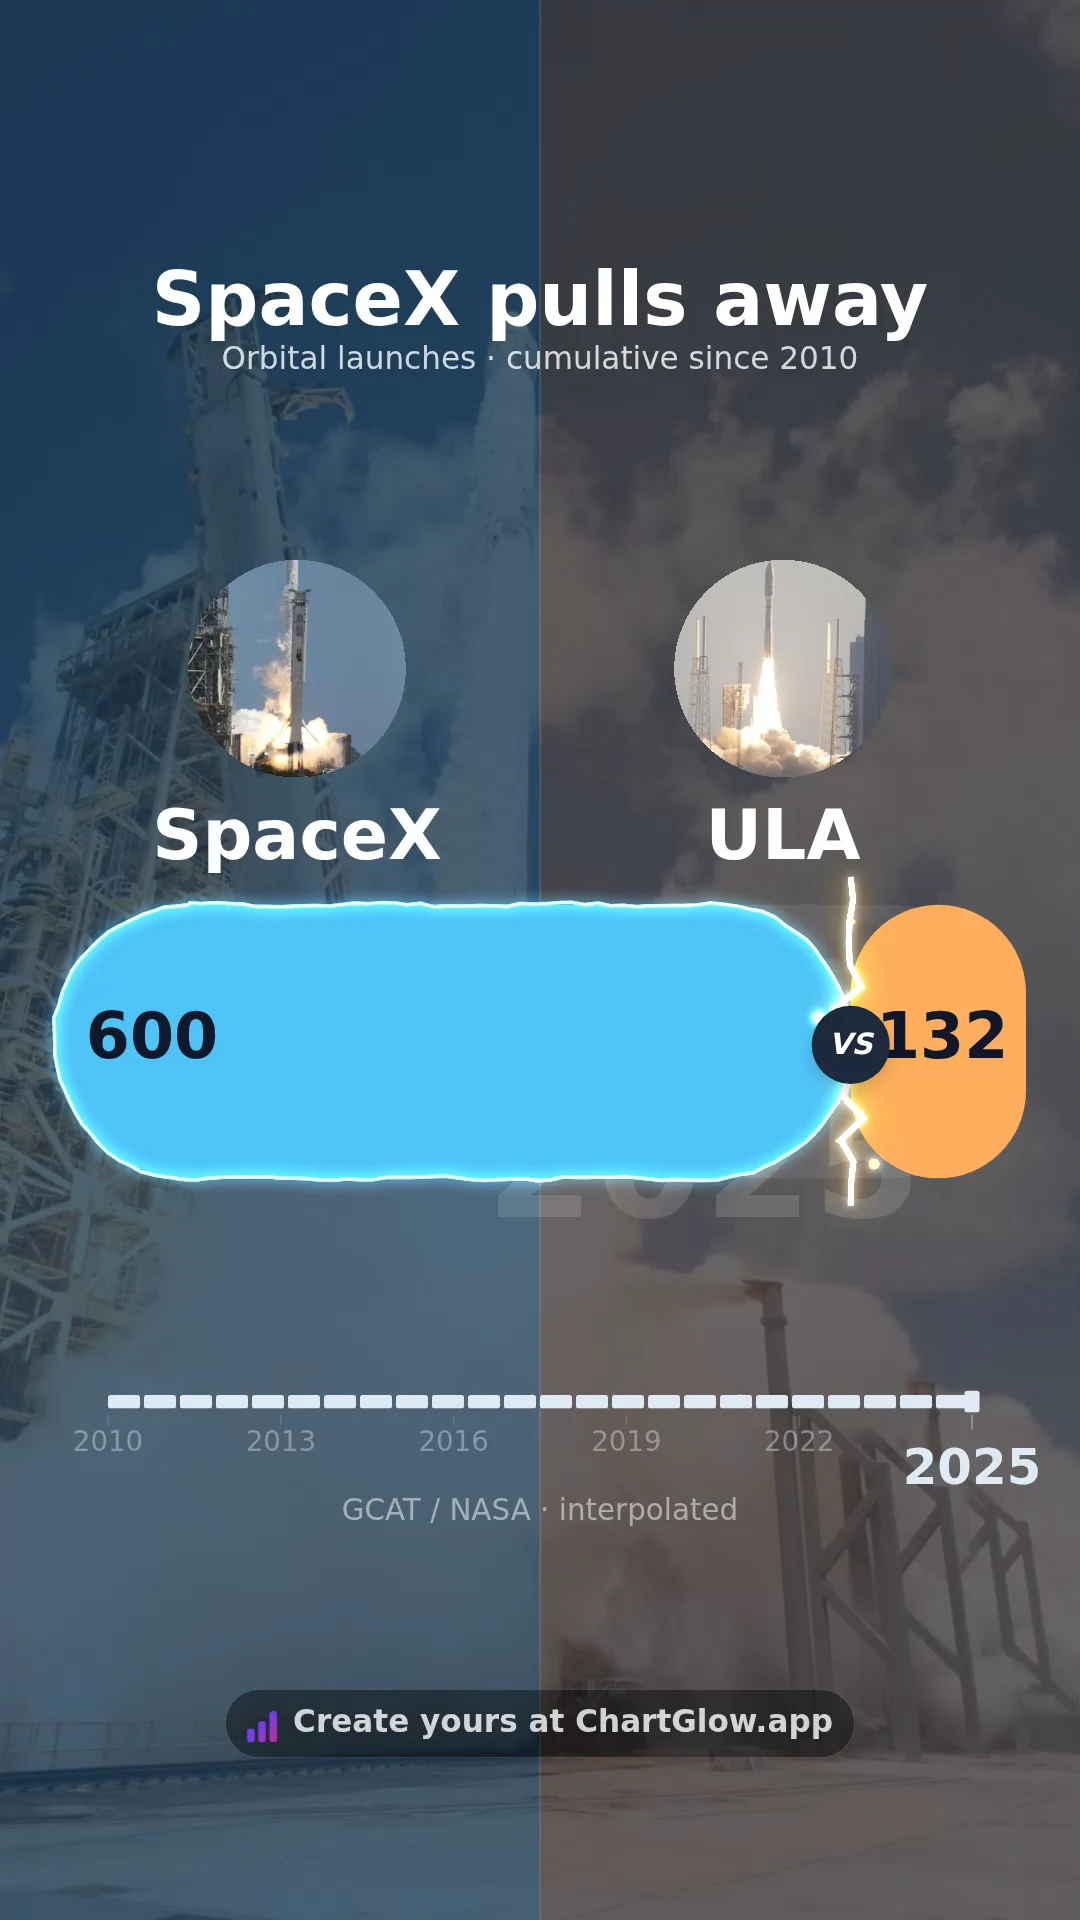
SpaceX pulls away
Compare SpaceX and ULA orbital launch attempts from a shared 2010 starting line.
Watch video →
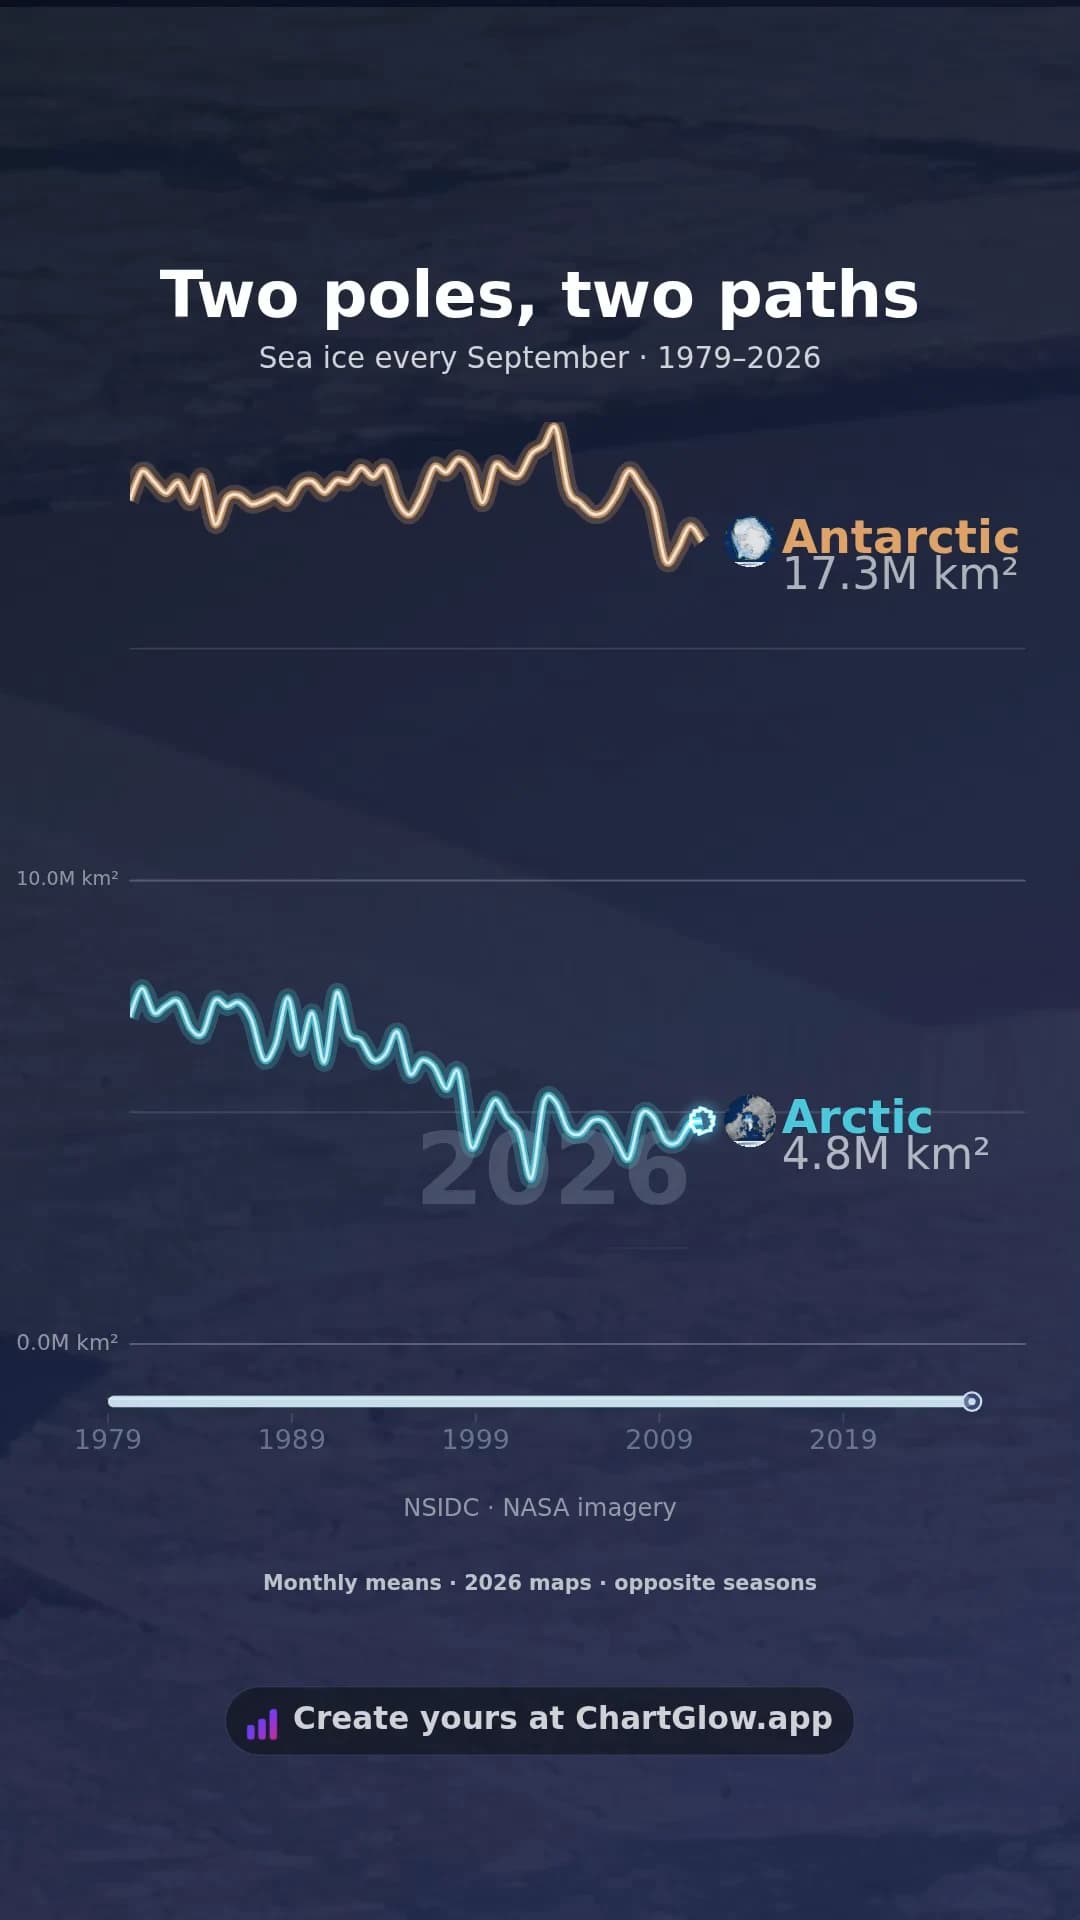
Two poles, two paths
Explore September sea ice across the Arctic and Antarctic from 1979 to 2026.
Watch video →
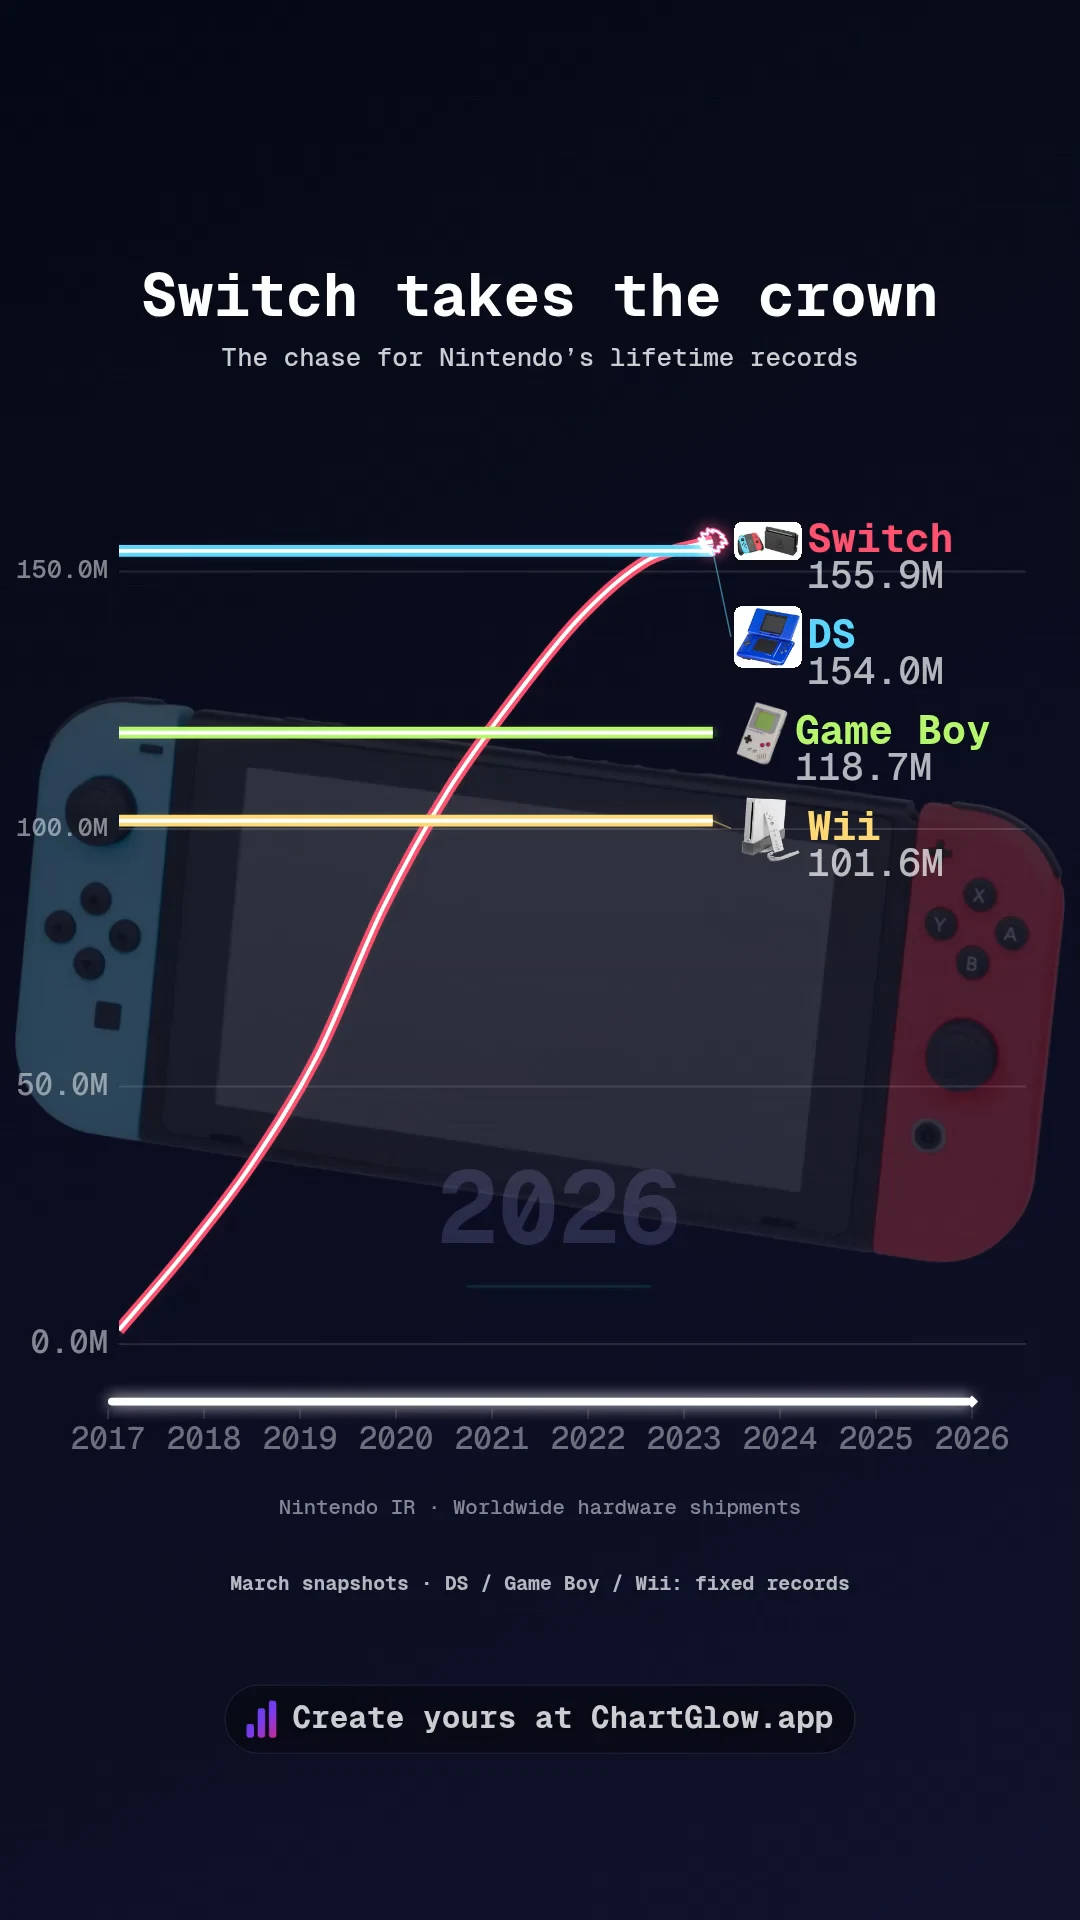
Switch takes the crown
Watch Switch chase the lifetime records of Wii, Game Boy and DS. Four consoles, three milestones, one new Nintendo No. 1.
Watch video →
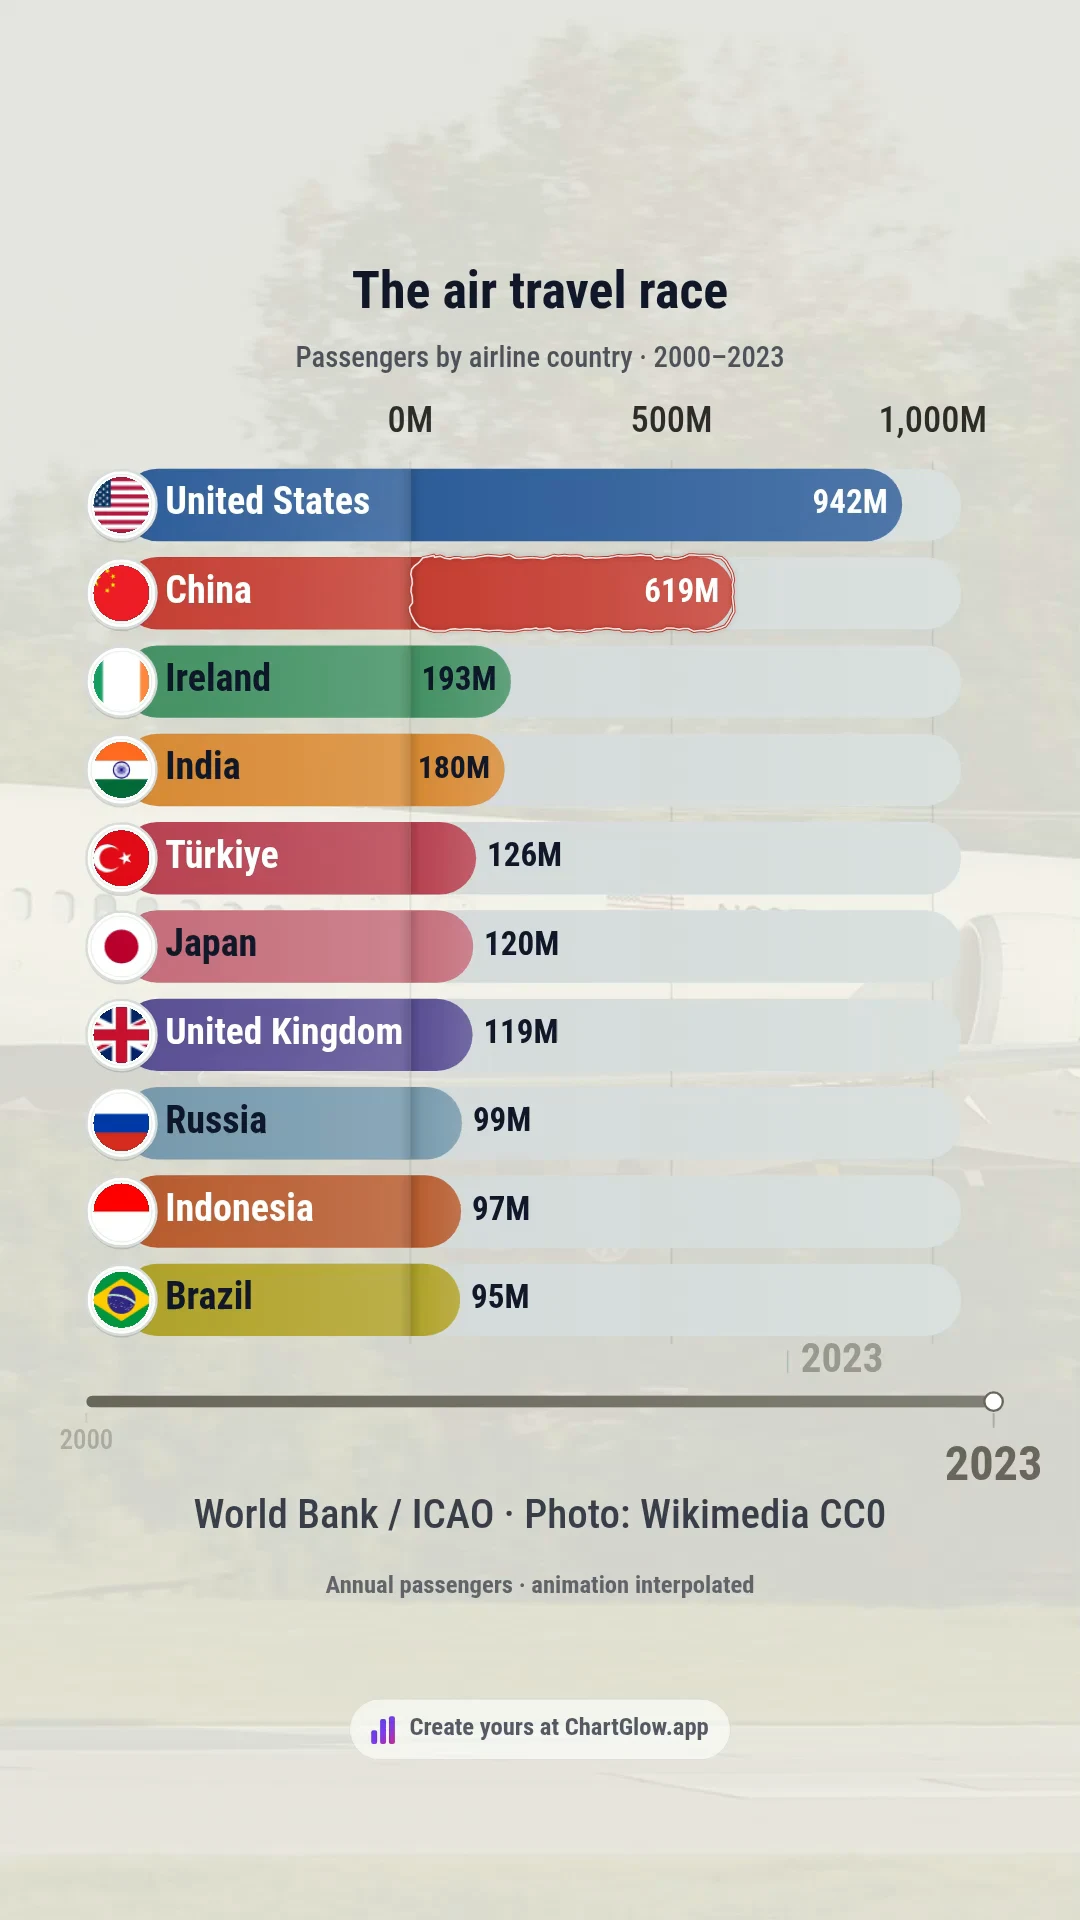
The air travel race
See how airlines in ten countries navigated two decades of growth and a sudden shock.
Watch video →
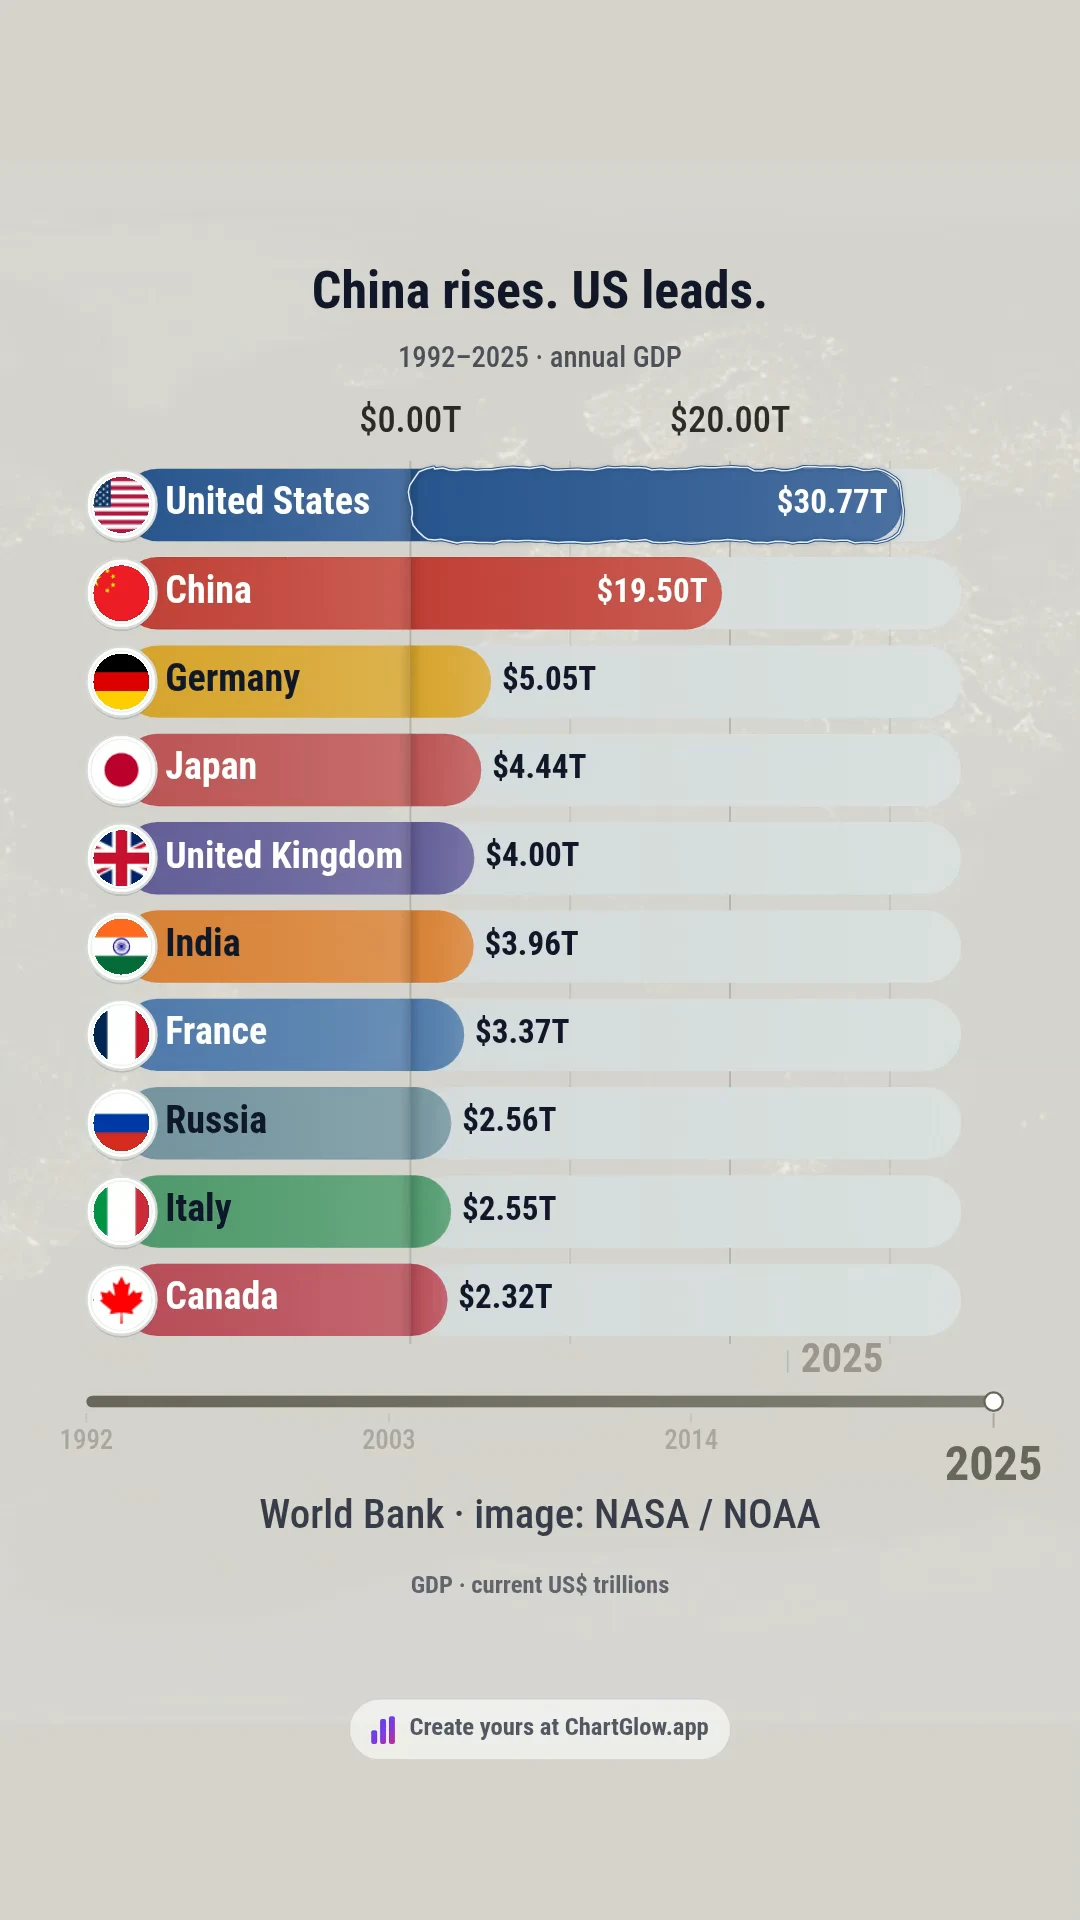
China rises. US leads.
Watch China rise among ten major economies from 1992 to 2025, while the United States remains first.
Watch video →
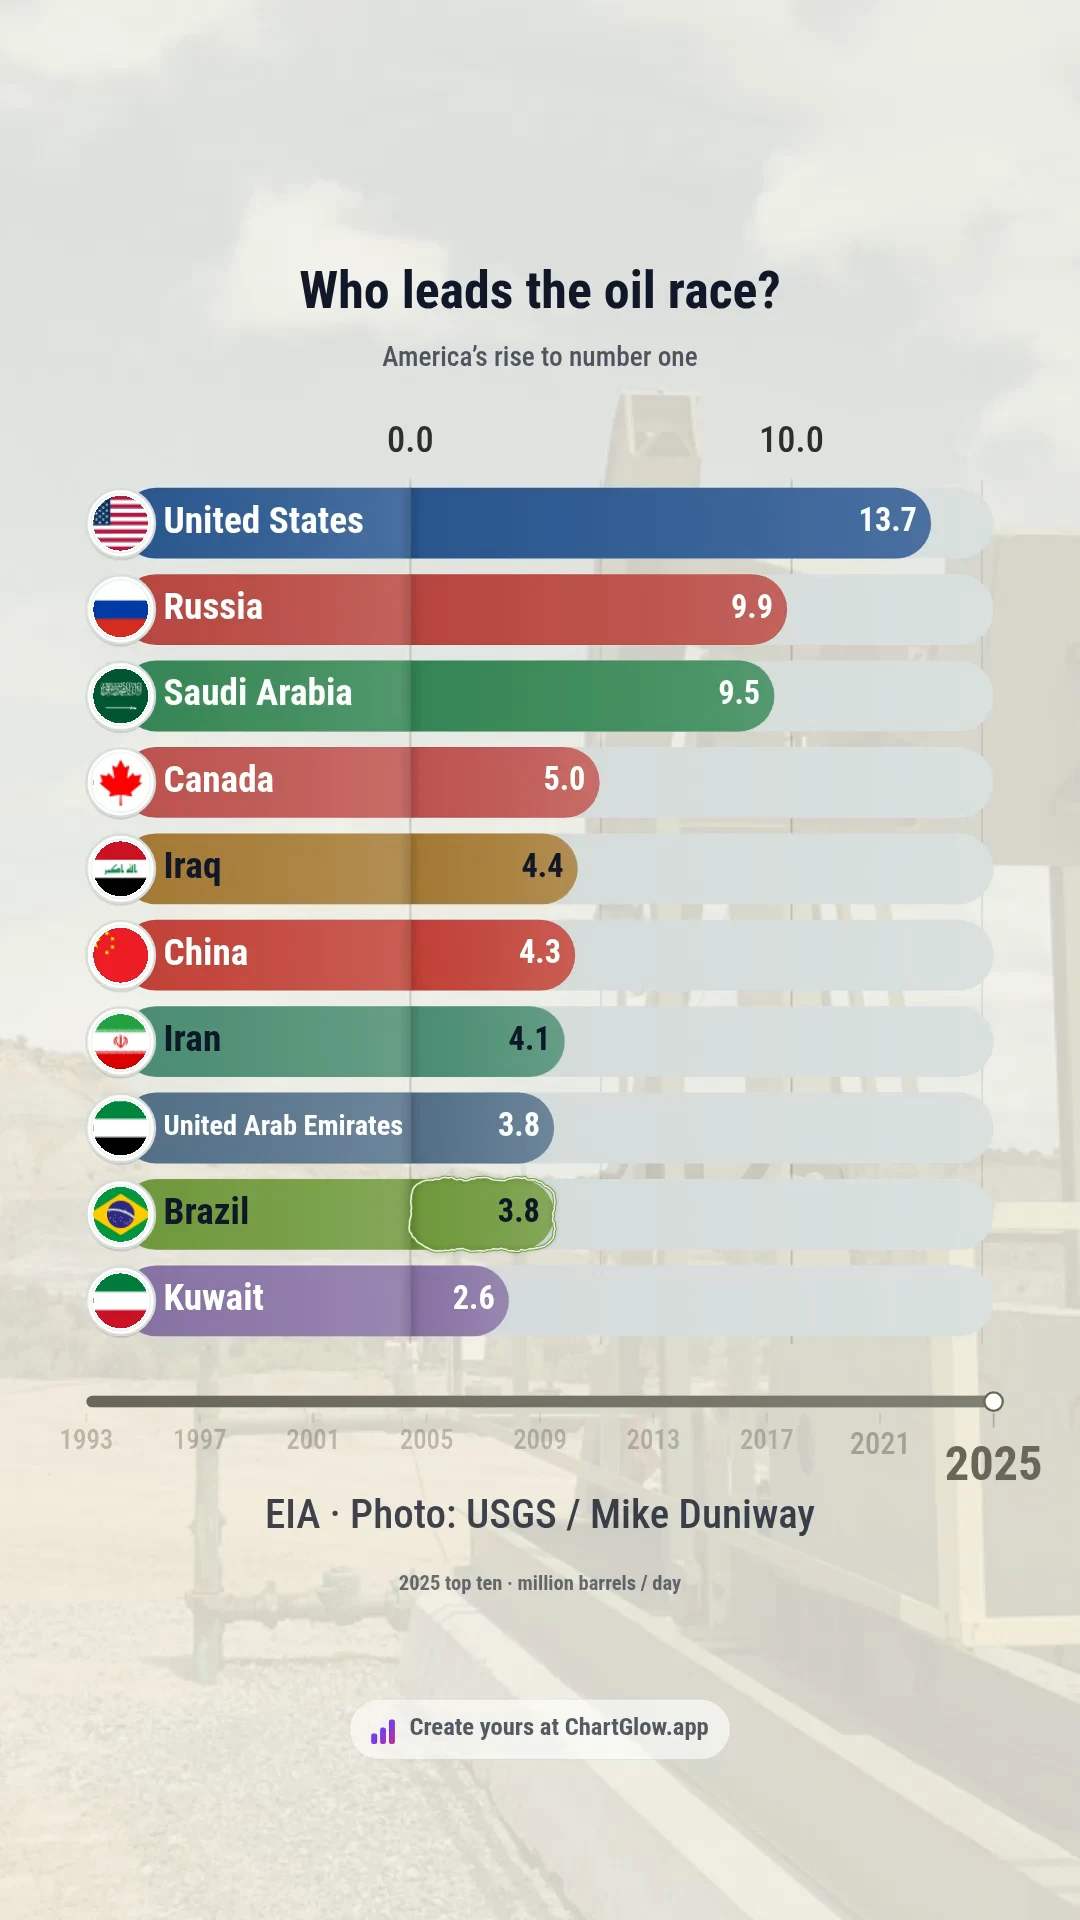
Who leads the oil race?
Watch the United States rise to first among ten major crude oil producers from 1993 to 2025.
Watch video →
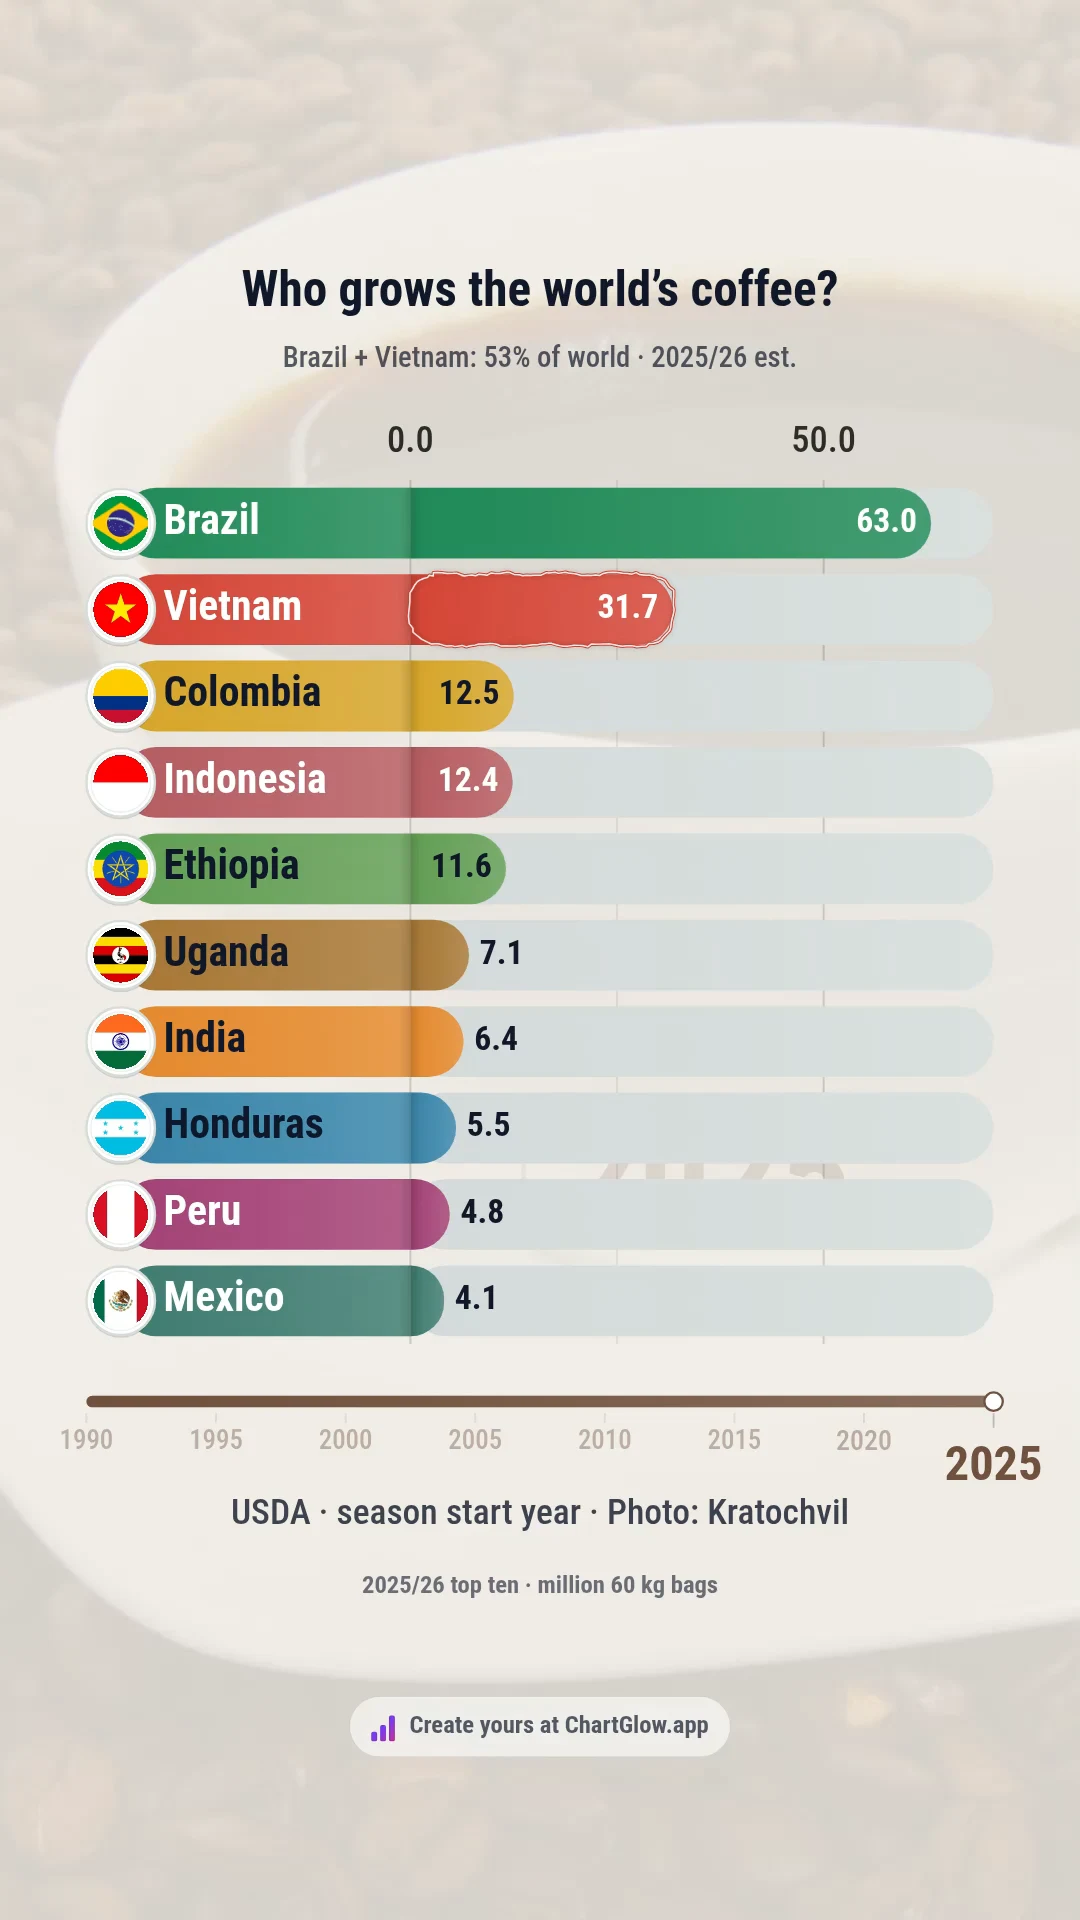
Who grows the world’s coffee?
See Brazil hold its lead as Vietnam rises among ten leading coffee producers from 1990/91 to 2025/26.
Watch video →
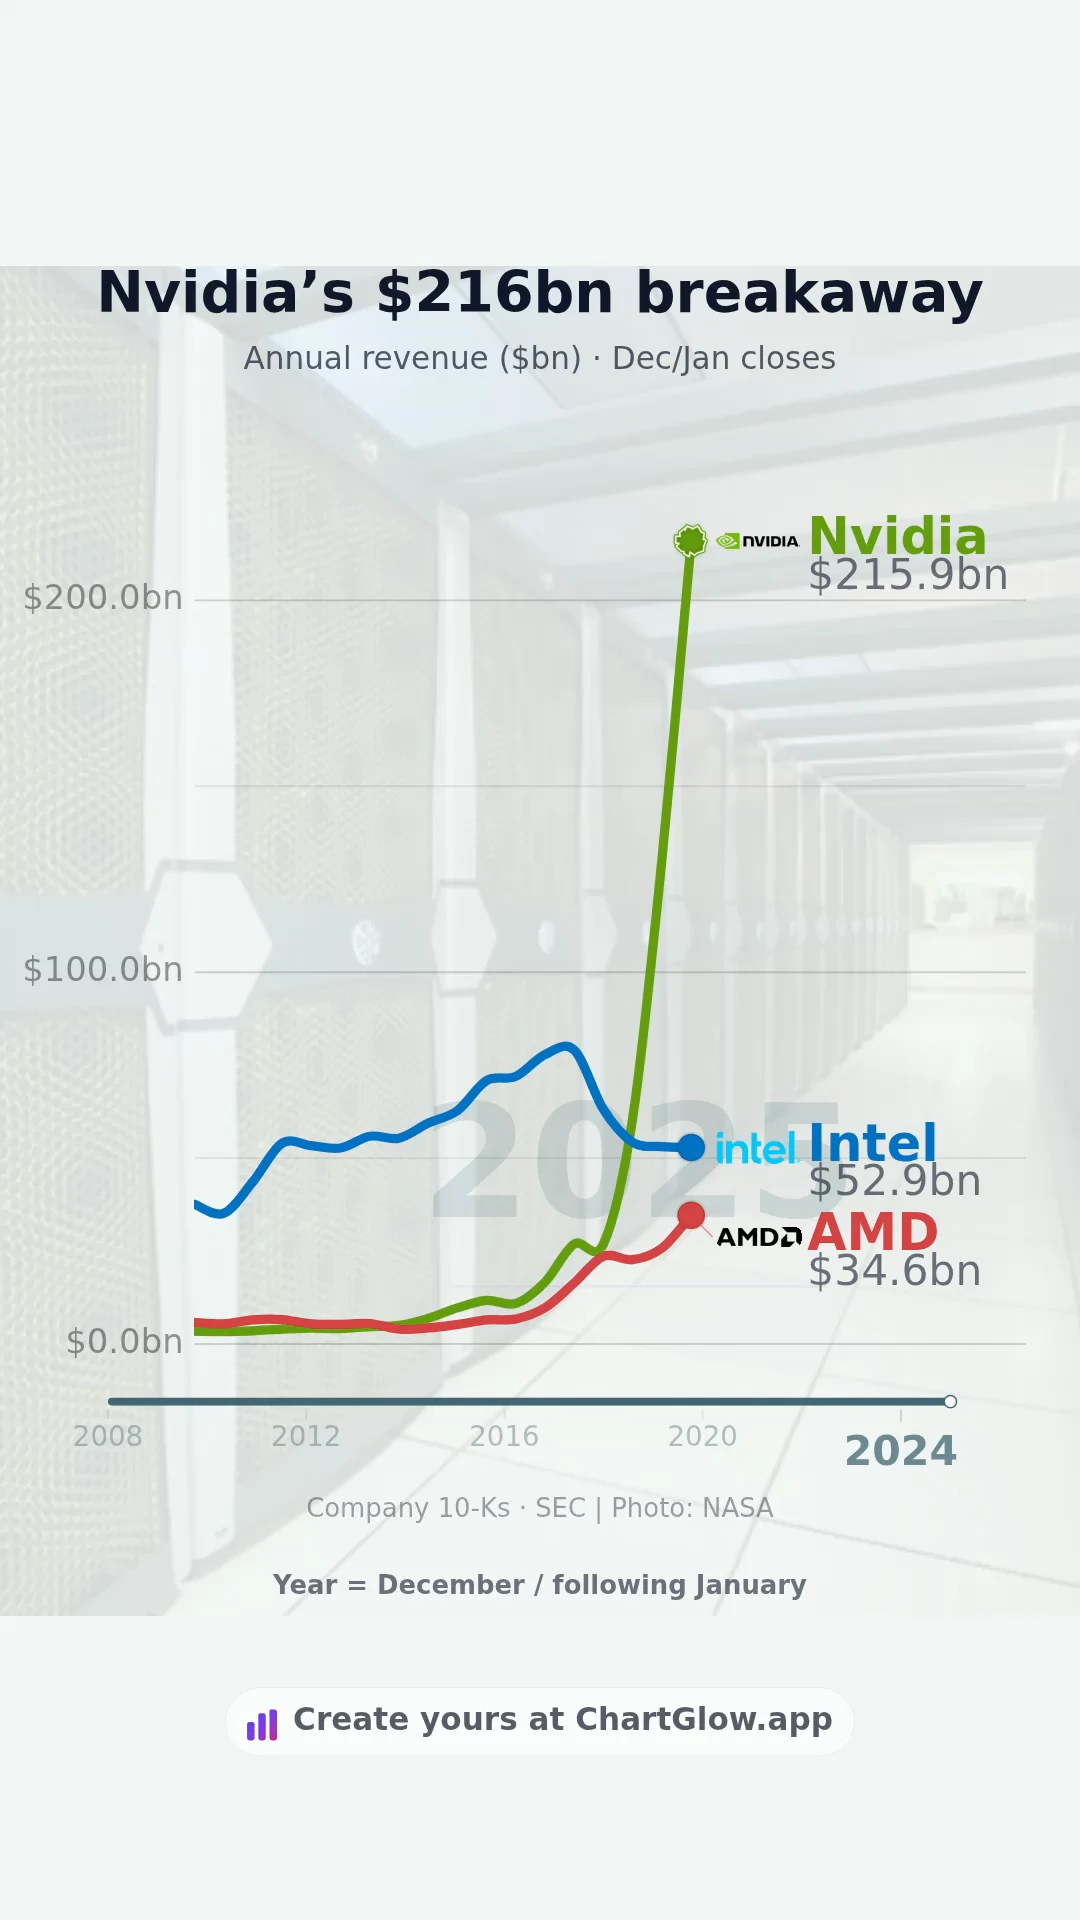
Nvidia’s $216bn breakaway
From the smallest of three computing rivals to more revenue than the other two combined. Follow Nvidia, Intel and AMD across 18 annual reporting periods.
Watch video →
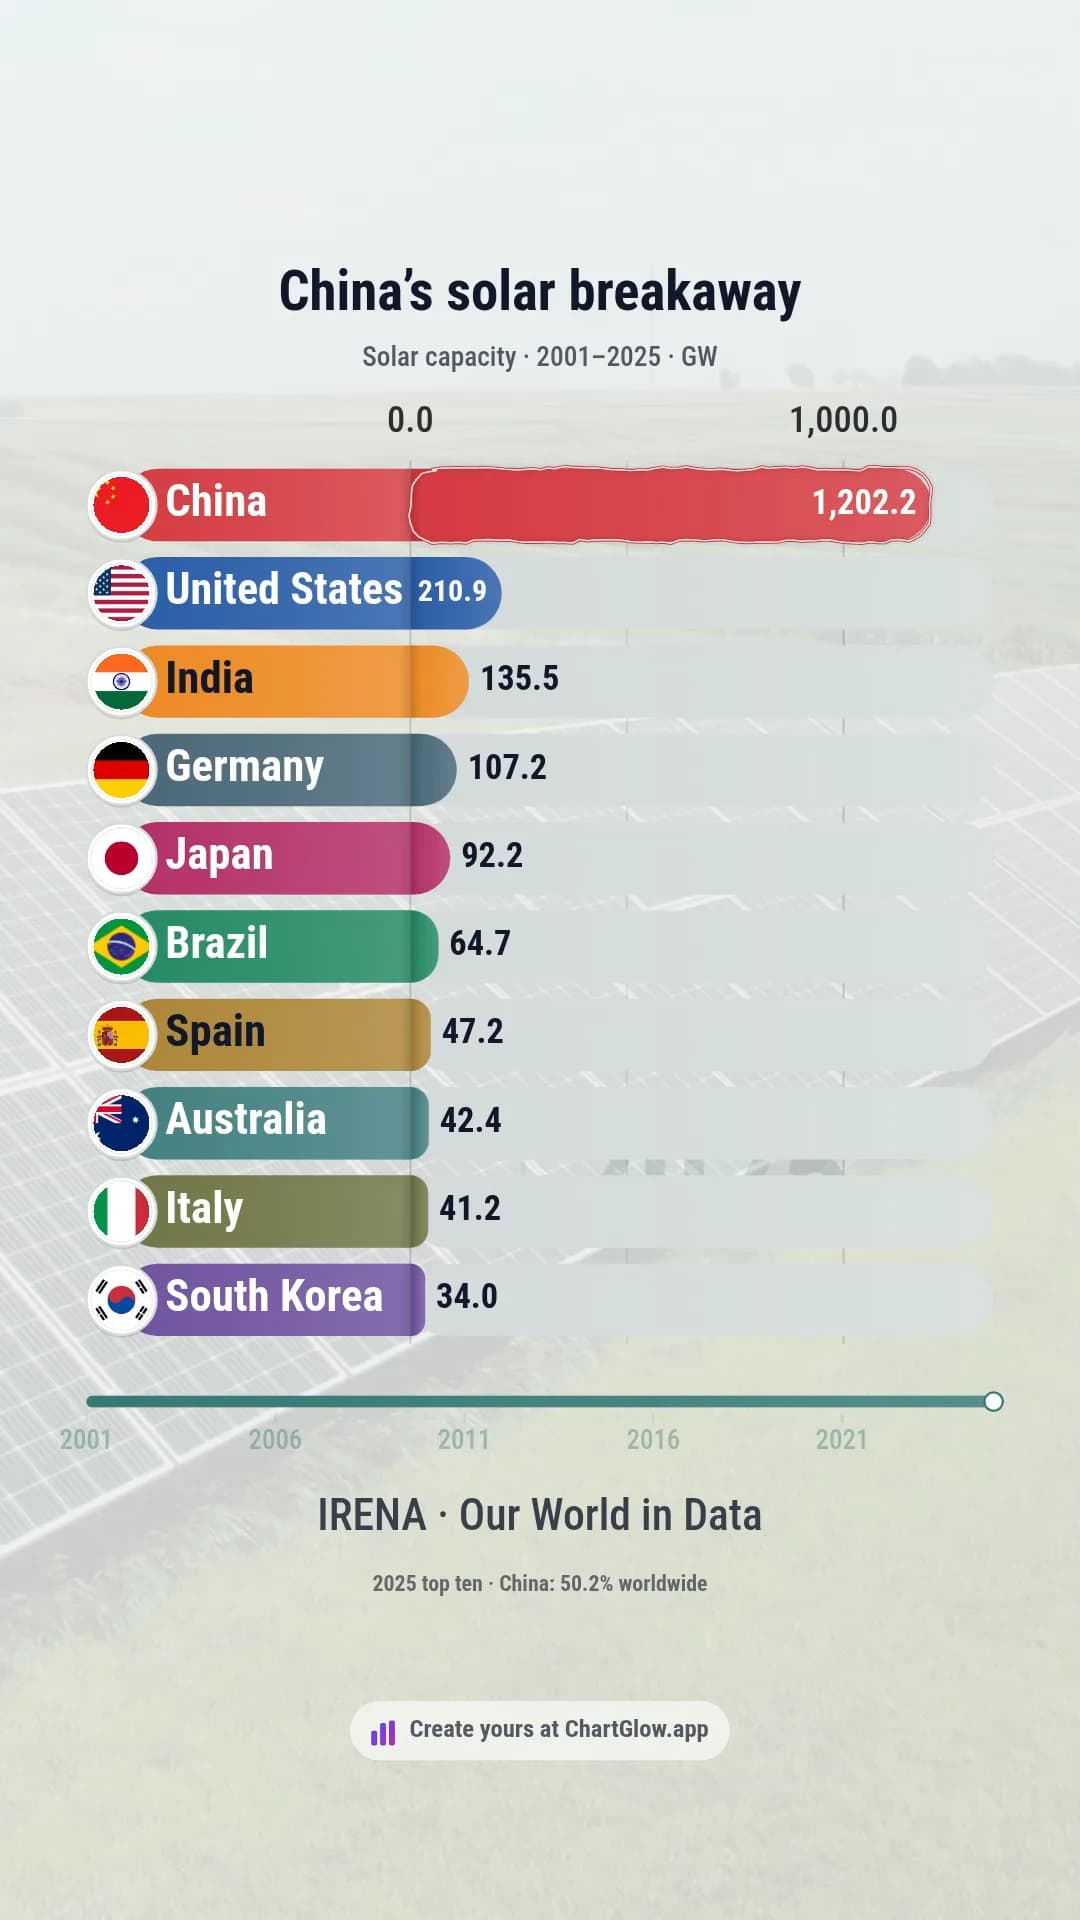
China’s solar breakaway · 2001–2025
China reaches 50.2% of global installed solar capacity in 2025. Follow its breakaway against nine other major solar markets from 2001–2025.
Watch video →
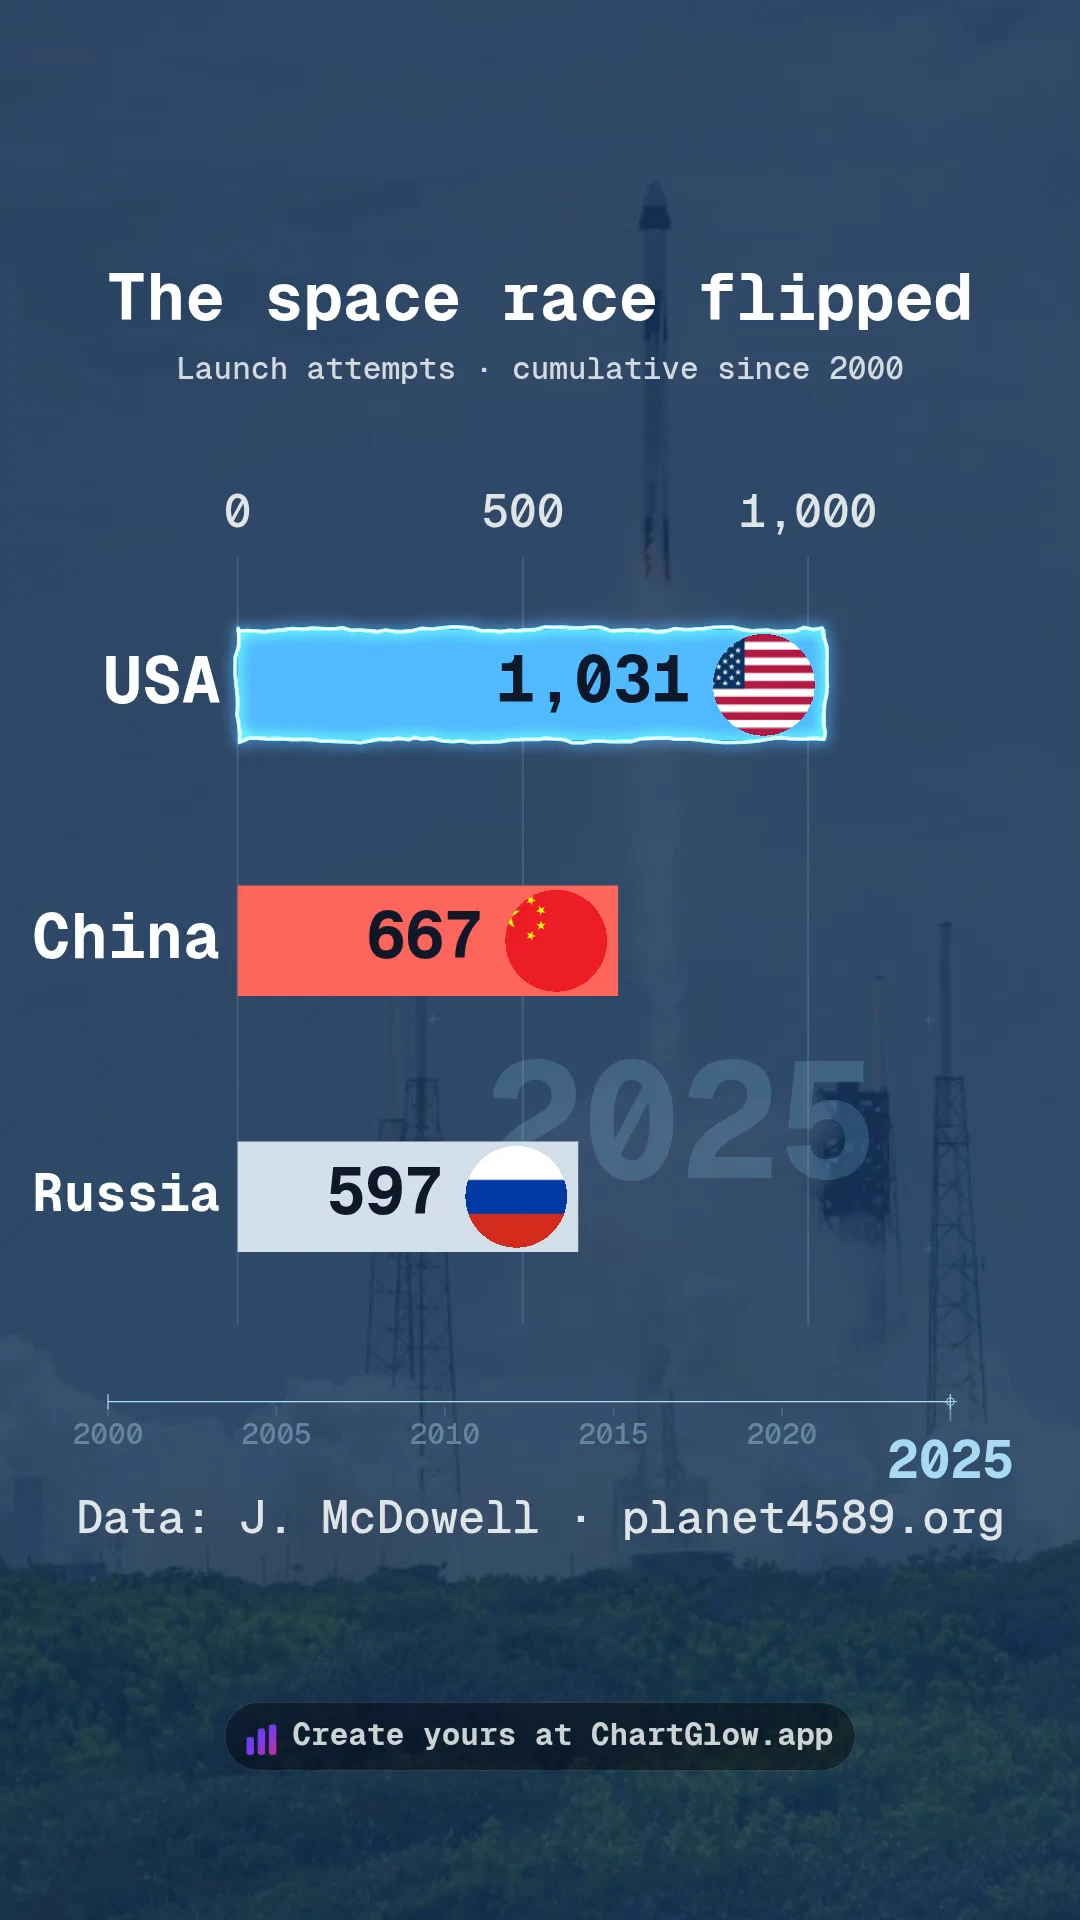
The space race flipped · 2000–2025
Russia leads for two decades, then the US passes in 2022 and China follows in 2025. Replay 26 years of cumulative orbital launch attempts from a shared 2000 starting line.
Watch video →
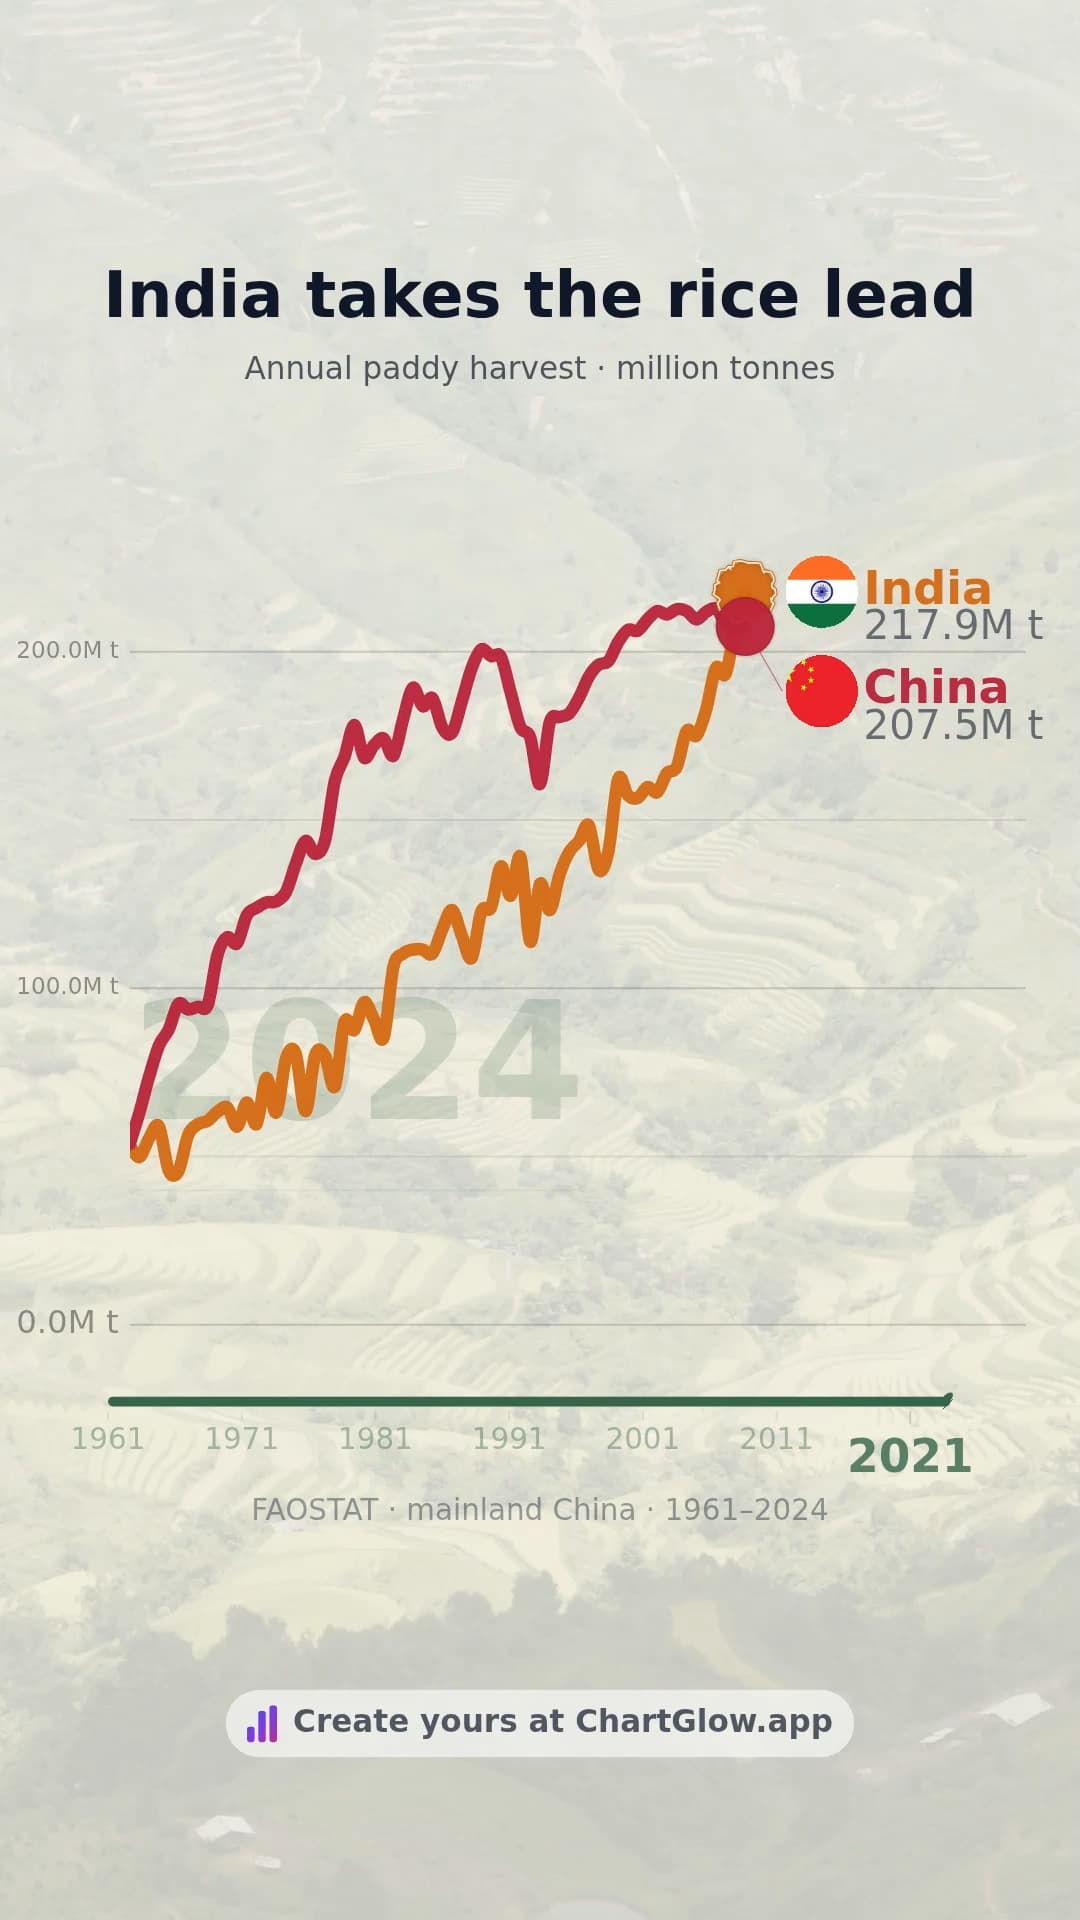
India takes the rice lead · 1961–2024
A 60-million-tonne gap becomes a lead of more than 10 million. Follow the annual paddy harvests of India and mainland China across 64 years.
Watch video →
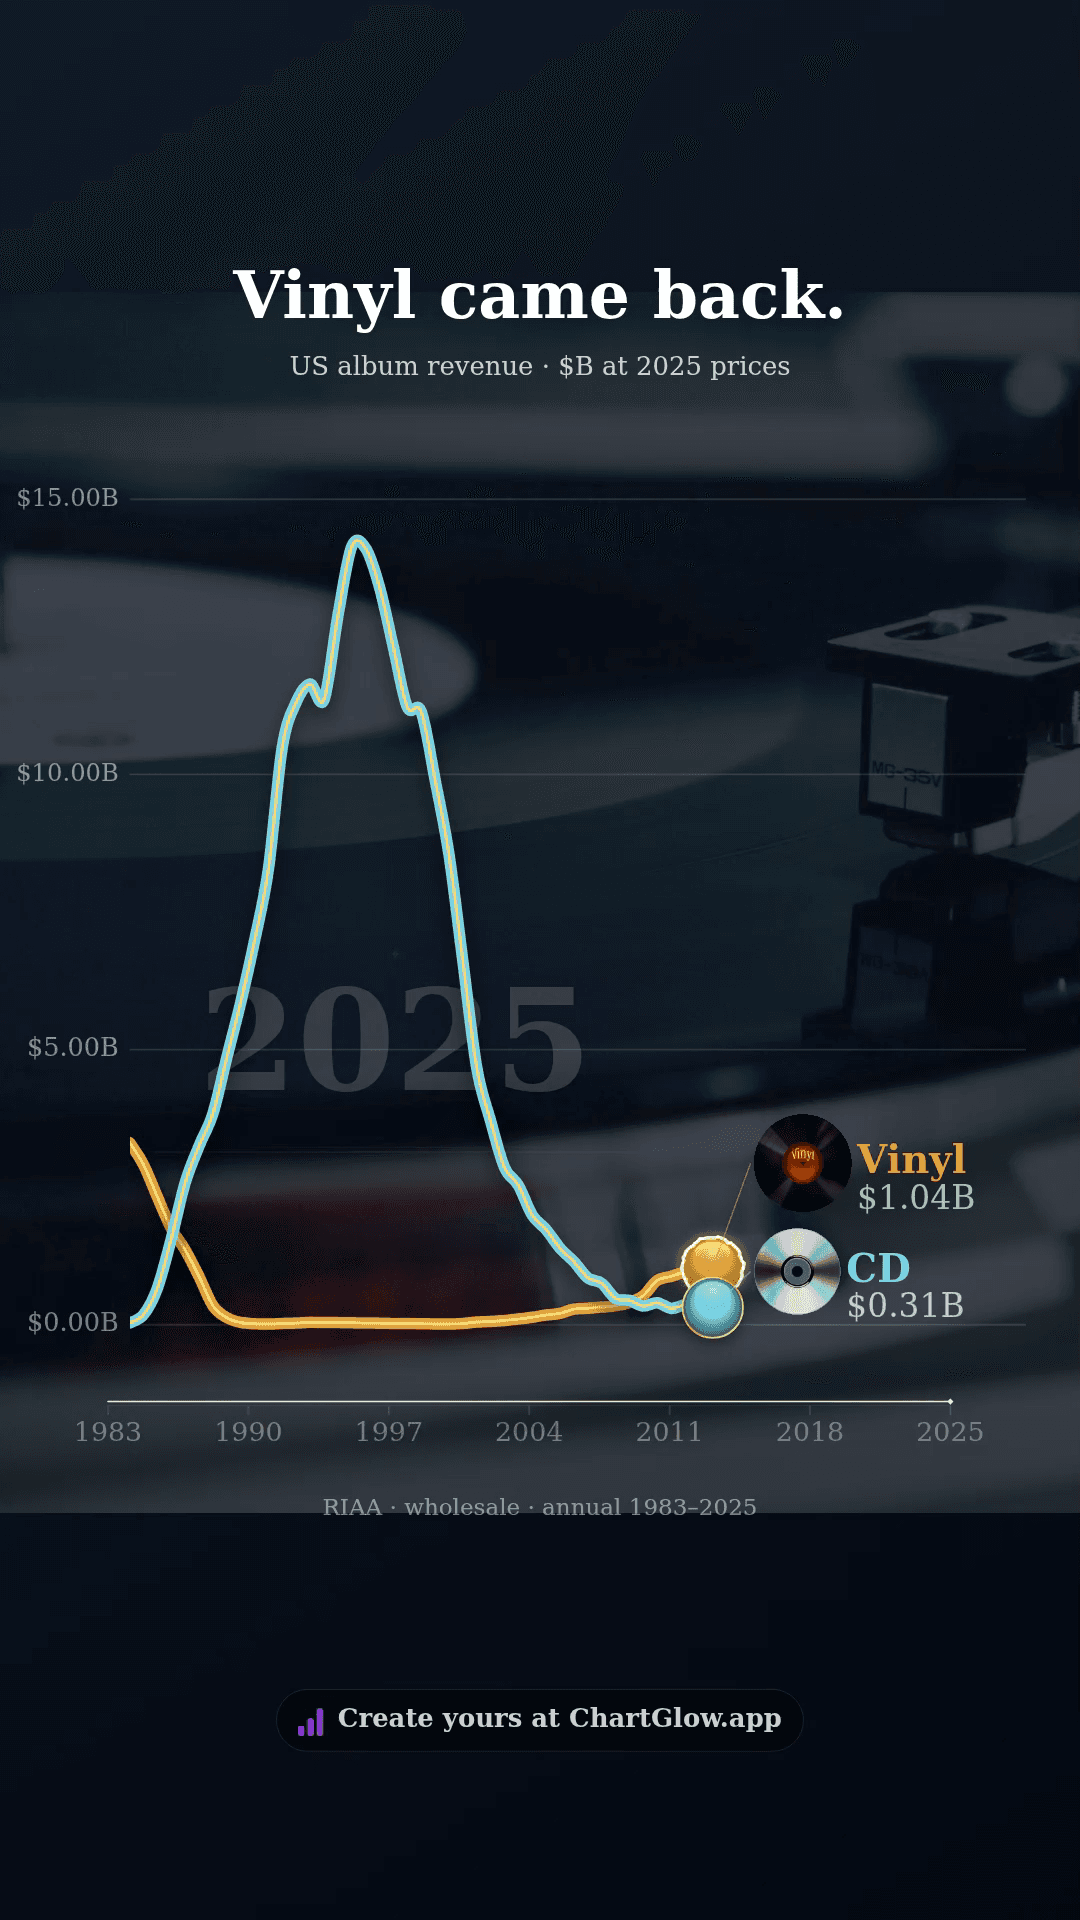
Vinyl came back · 1983–2025
The CD takes over, towers over vinyl, then loses the revenue lead. Follow 43 years of US album revenues, adjusted to 2025 dollars.
Watch video →
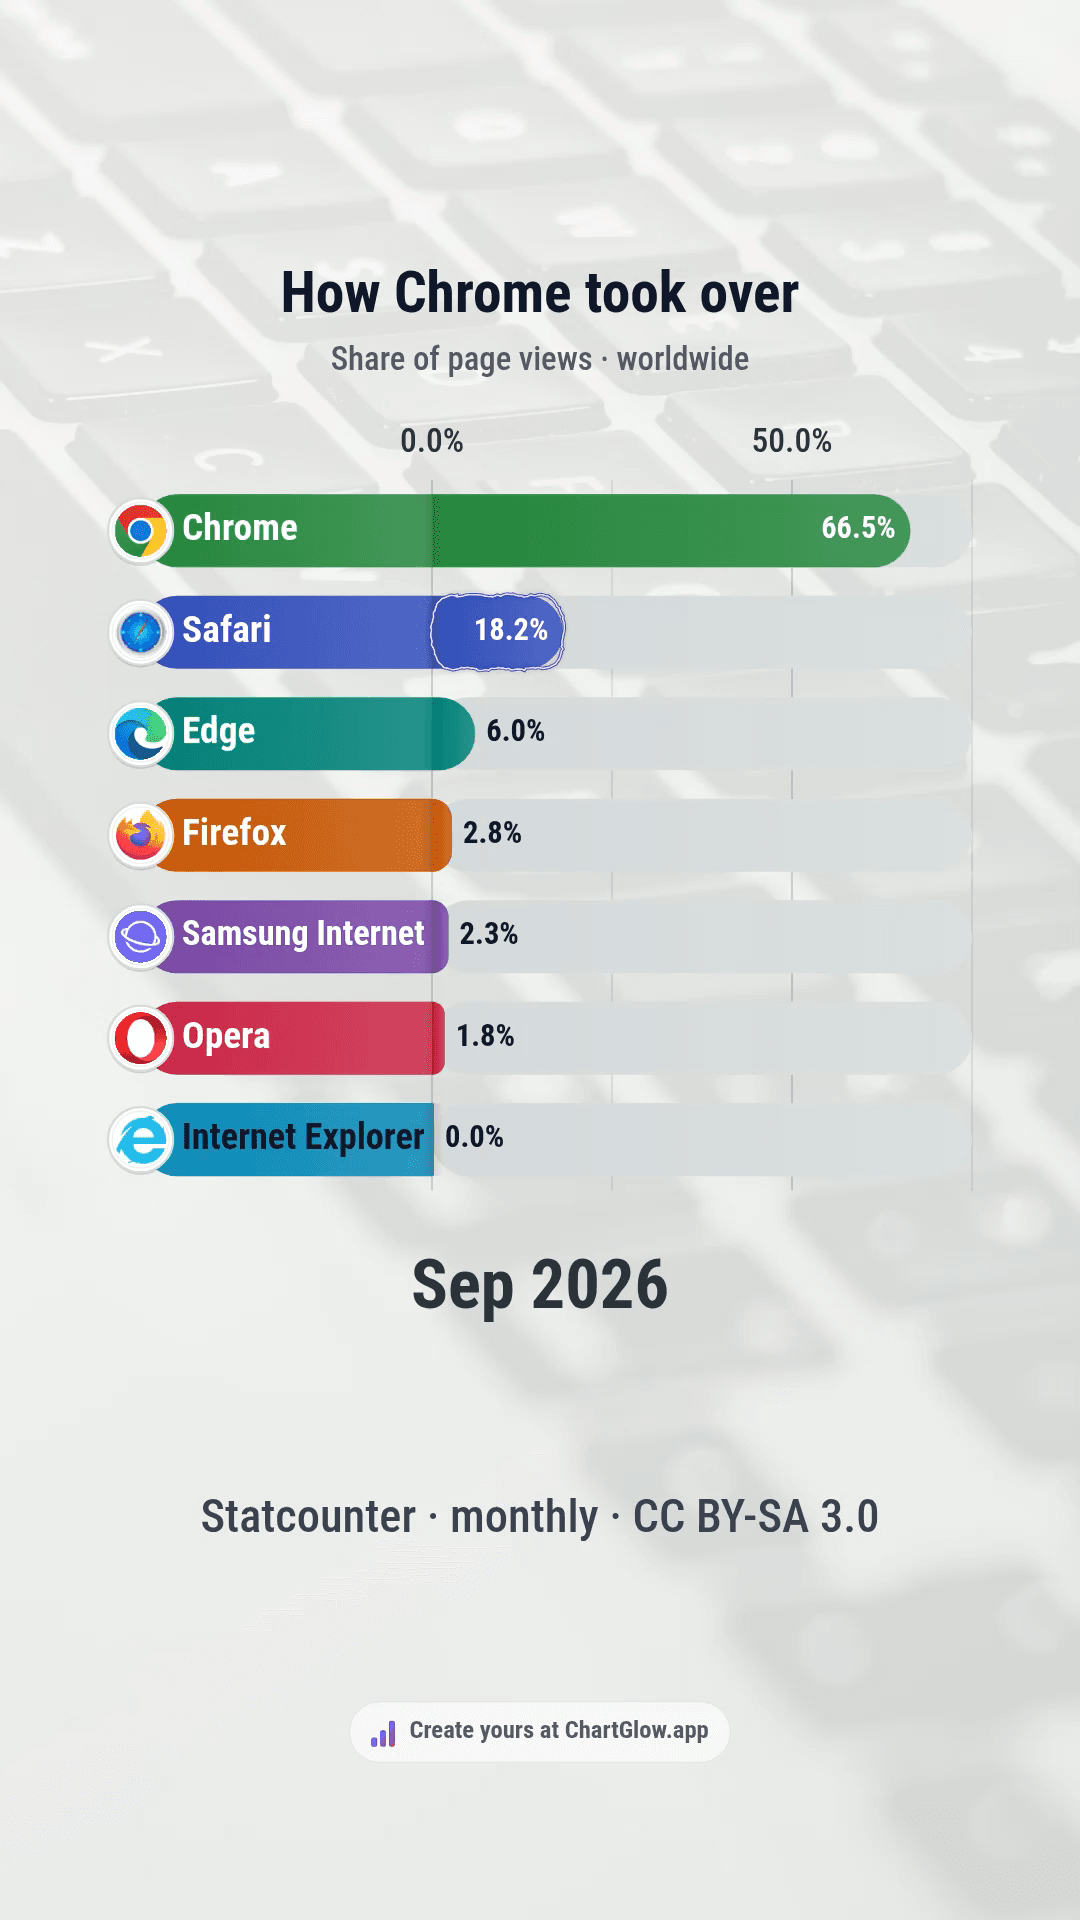
How Chrome took over · 2009–2026
Watch Chrome climb from 1.37% to two-thirds of measured worldwide browsing, as Internet Explorer loses the crown. Seven browsers, 213 months and one extraordinary reversal.
Watch video →
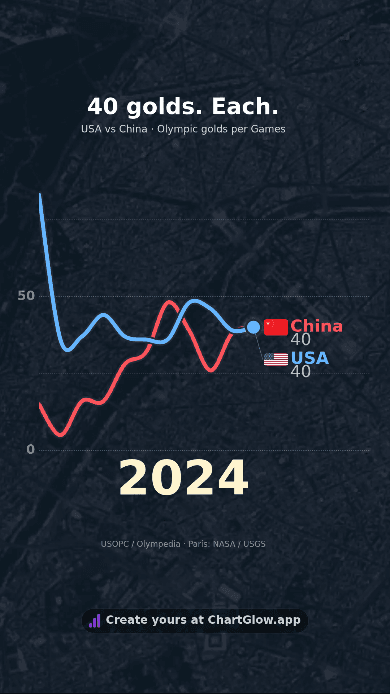
USA vs China: 40 golds each
Eleven Summer Games, 1984–2024: a Chinese lead in Beijing, a one-gold gap in Tokyo and a 40–40 finish in Paris. Explore the native Line video and the exact 22 medal counts.
Watch video →
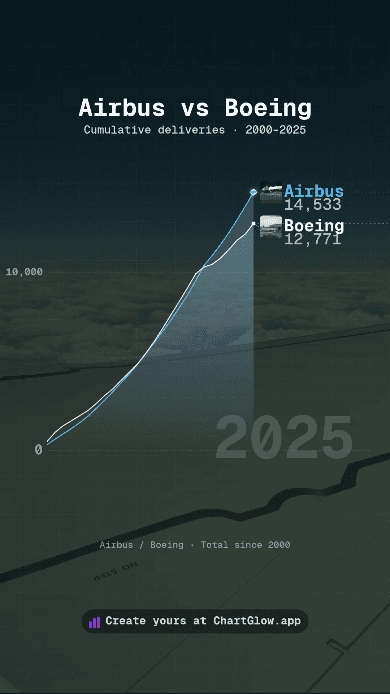
Airbus vs Boeing · The long delivery race · 2000–2025
A 26-year duel in cumulative reported deliveries: watch Airbus overtake Boeing in 2019.
Watch video →
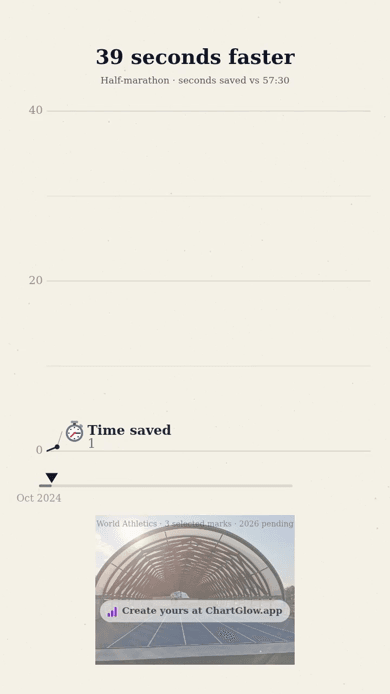
The lead switched sides · Kiplimo vs Sawe · 2022 & 2024
Kiplimo and Sawe: compare four listed half-marathon marks across the selected 2022 and 2024 seasons.
Watch video →
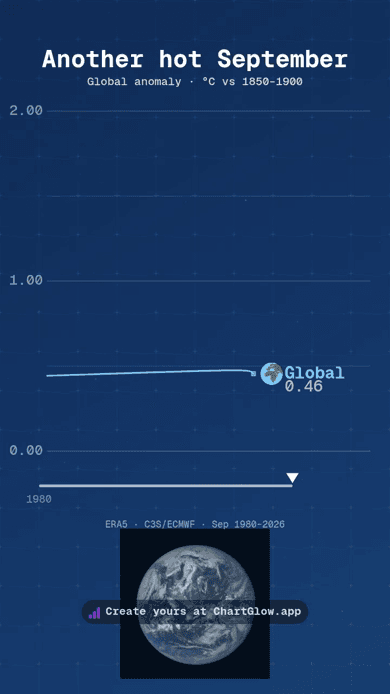
One planet, two warming paths · 1980–2025
Compare annual temperature anomalies in the Northern and Southern hemispheres, 1980–2025.
Watch video →
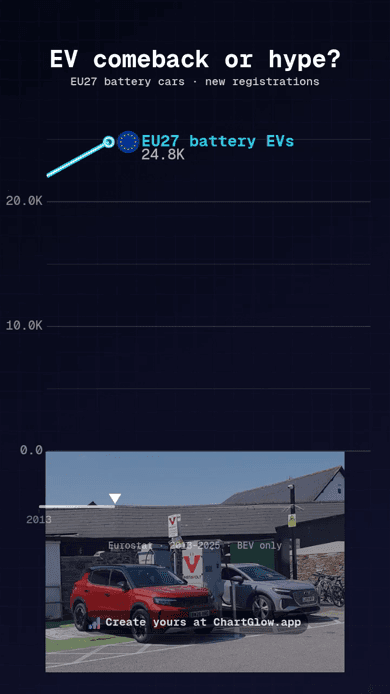
Europe's electric divide · 4 countries · 2020–2025
Compare the battery-electric share of new cars in France, Germany, Italy and Norway, 2020–2025.
Watch video →
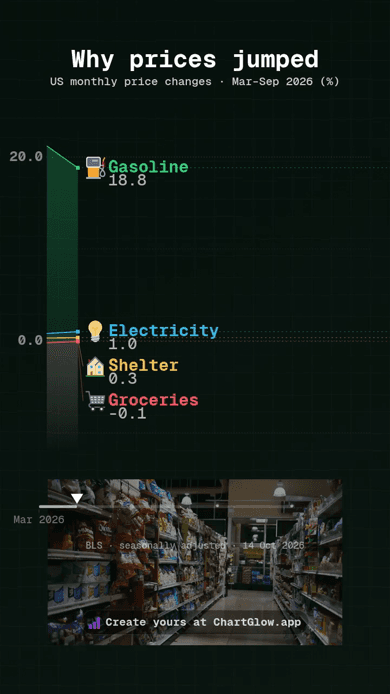
Why US prices jumped · Mar–Sep 2026
Gasoline, groceries, electricity and shelter: compare seven months of US price changes.
Watch video →
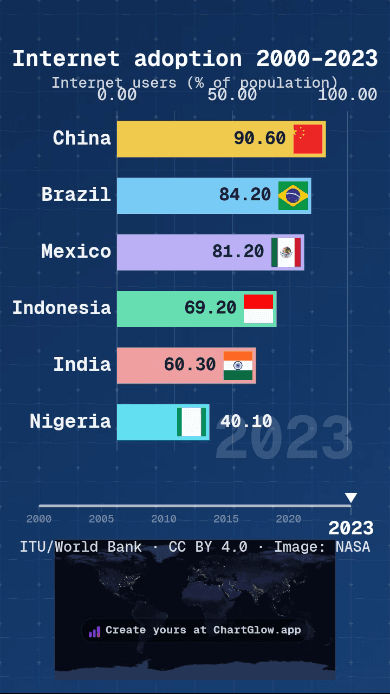
Internet adoption 2000–2023
Internet use across six selected countries at six observed dates, with country flags and a NASA night-lights illustration.
Watch video →
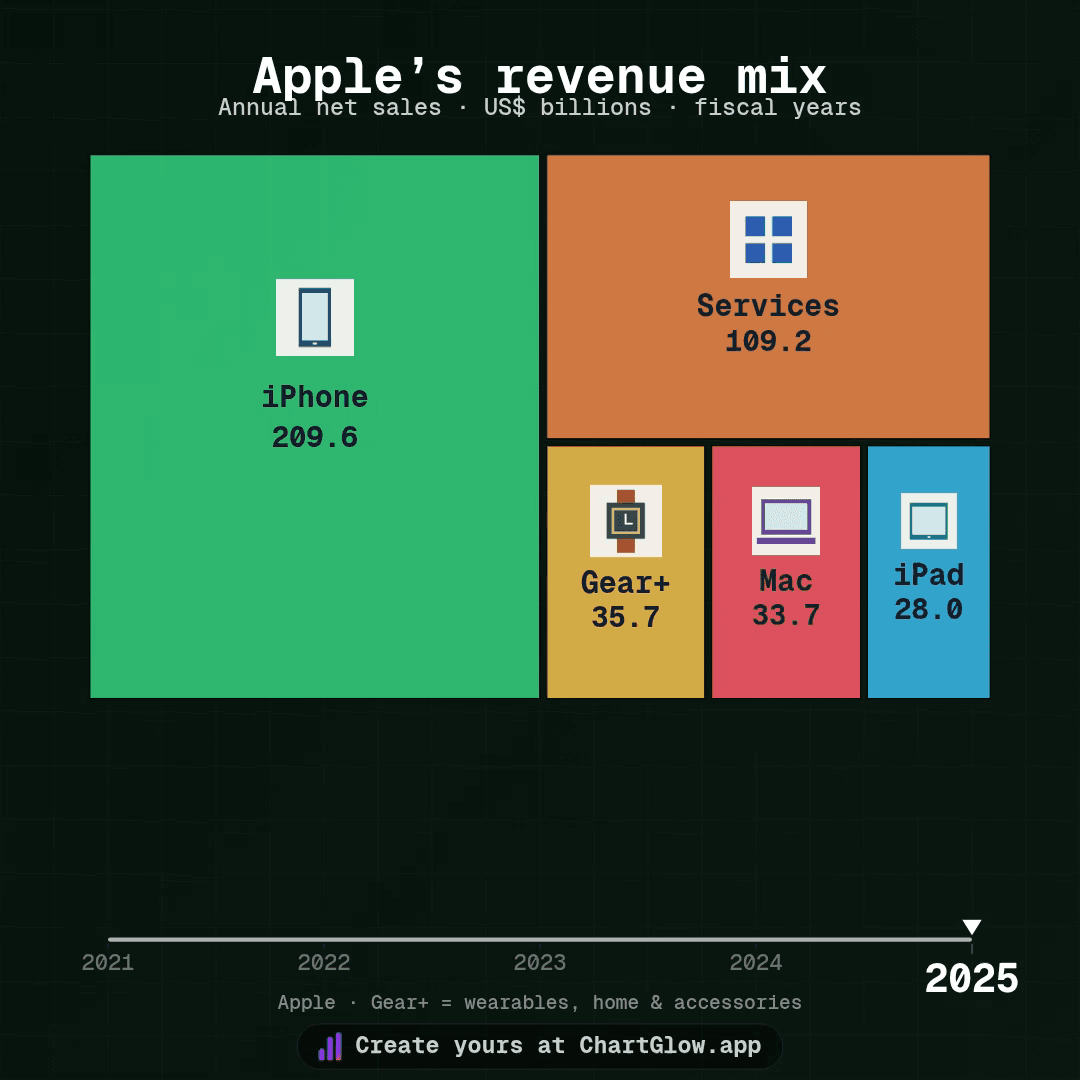
Apple’s revenue mix · FY2021–2025
See how Apple’s five revenue categories share the whole business. Annual net sales from fiscal 2021 to 2025 in US$ billions, animated as a native Treemap.
Watch video →
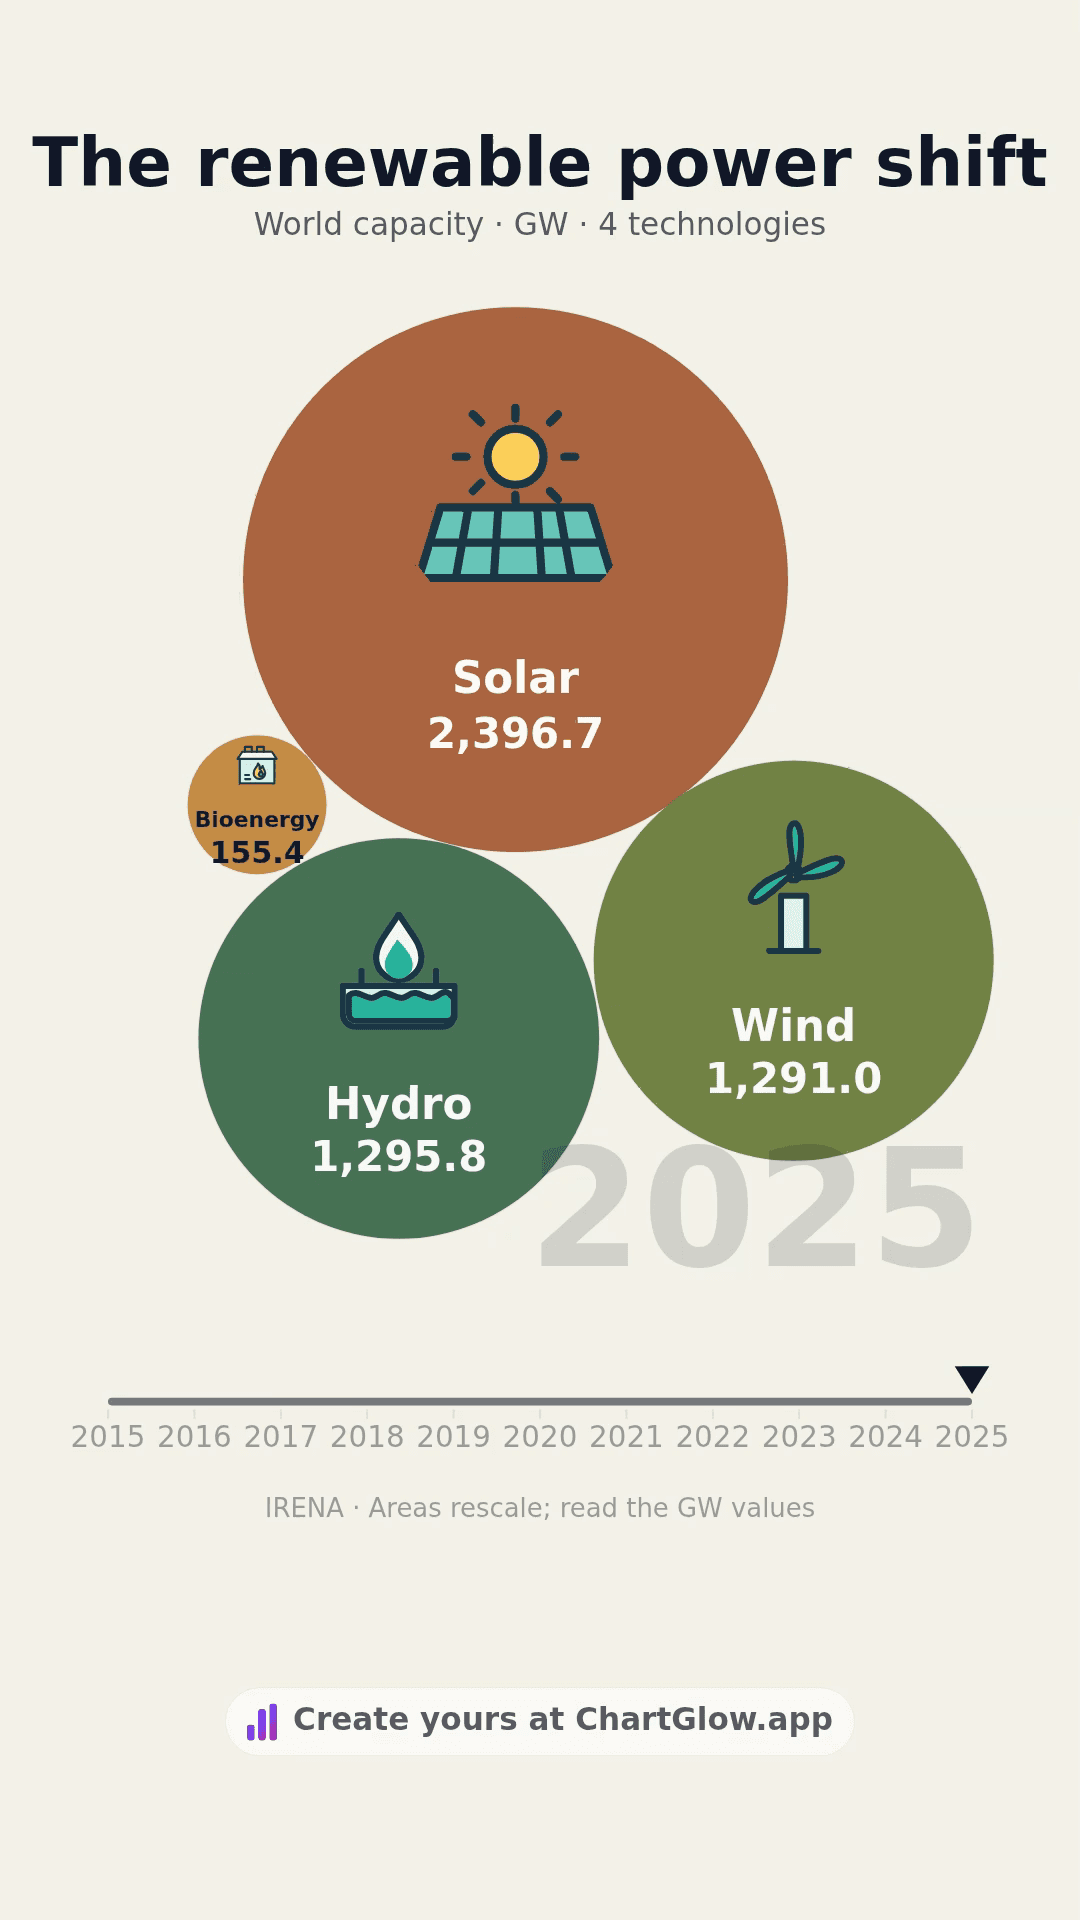
The renewable power shift · 2015–2025
Watch solar catch up with hydropower as four renewable electricity technologies grow worldwide. Explore IRENA year-end installed capacity with a native Bubble chart.
Watch video →
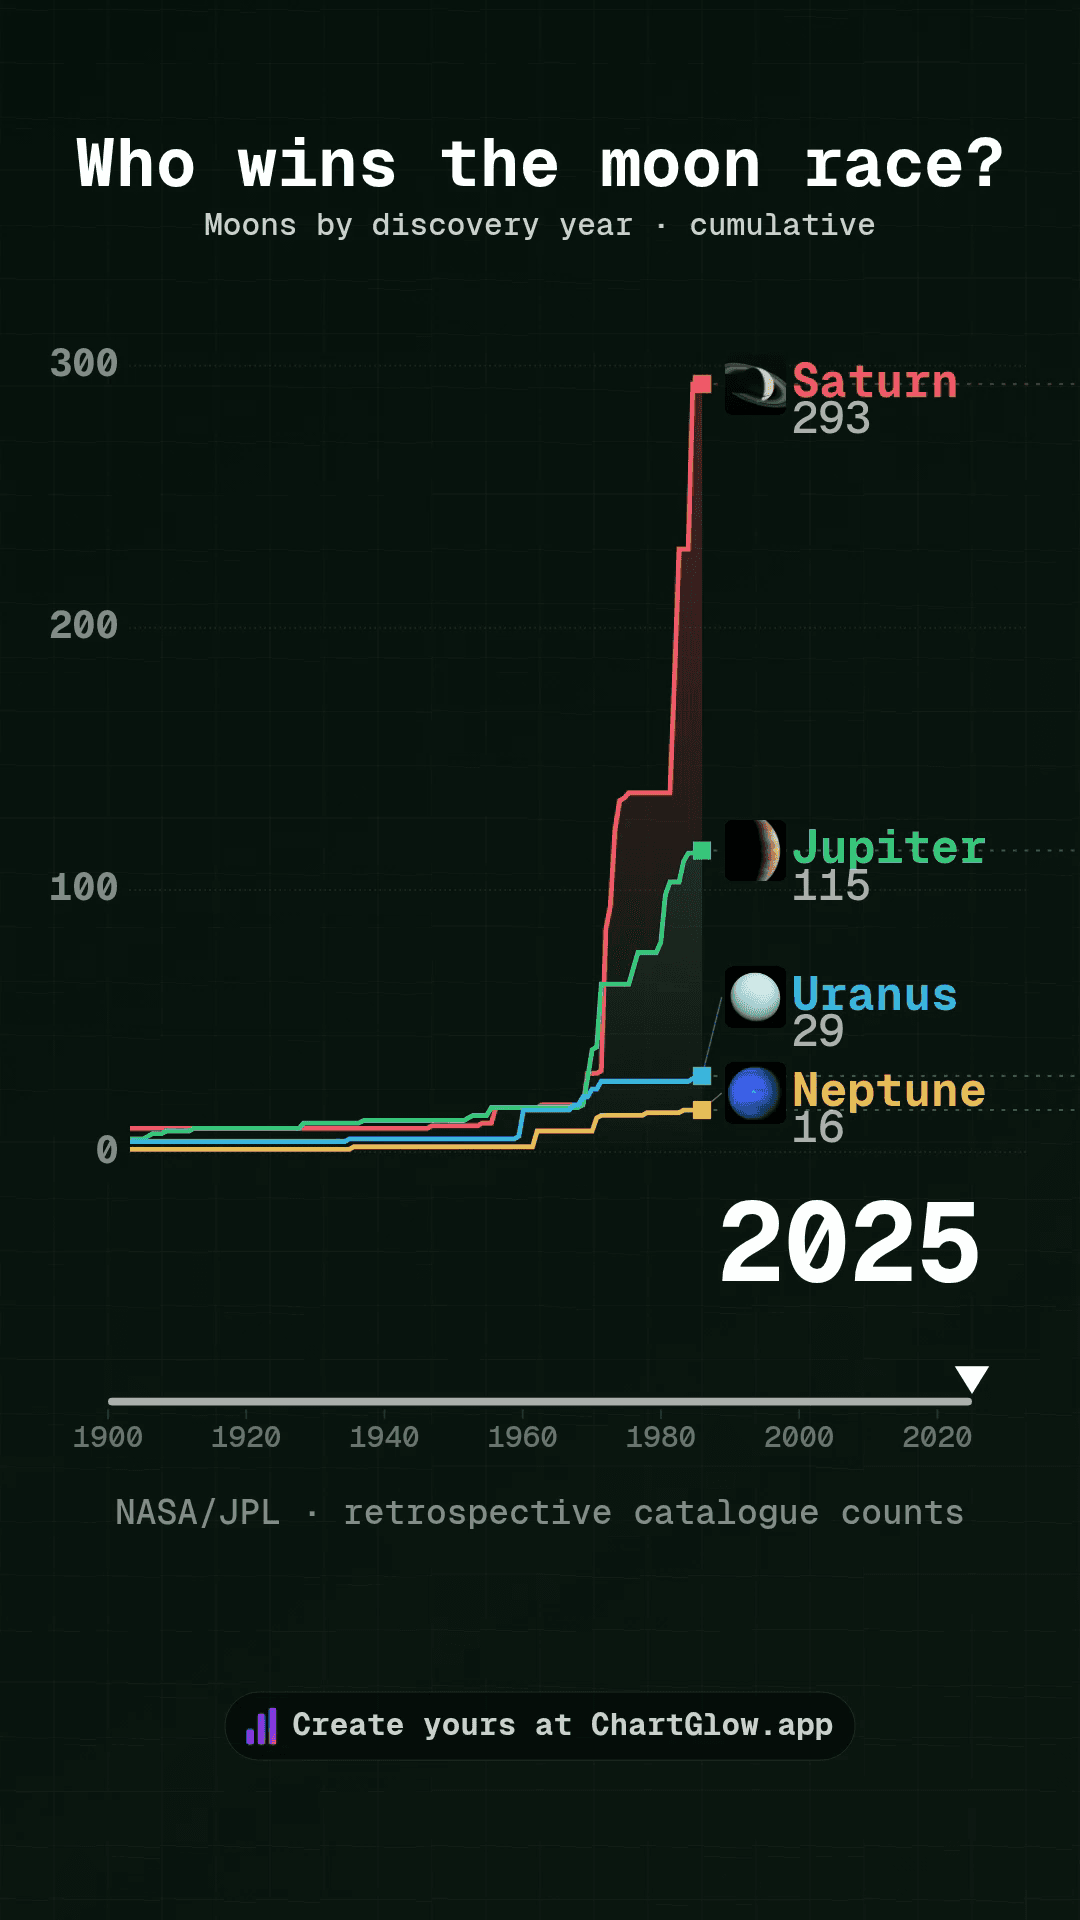
Which planet wins the moon race? · 1900–2025
Four giant planets, 504 annual counts. Follow moon discoveries through a retrospective JPL catalogue reconstruction.
Watch video →
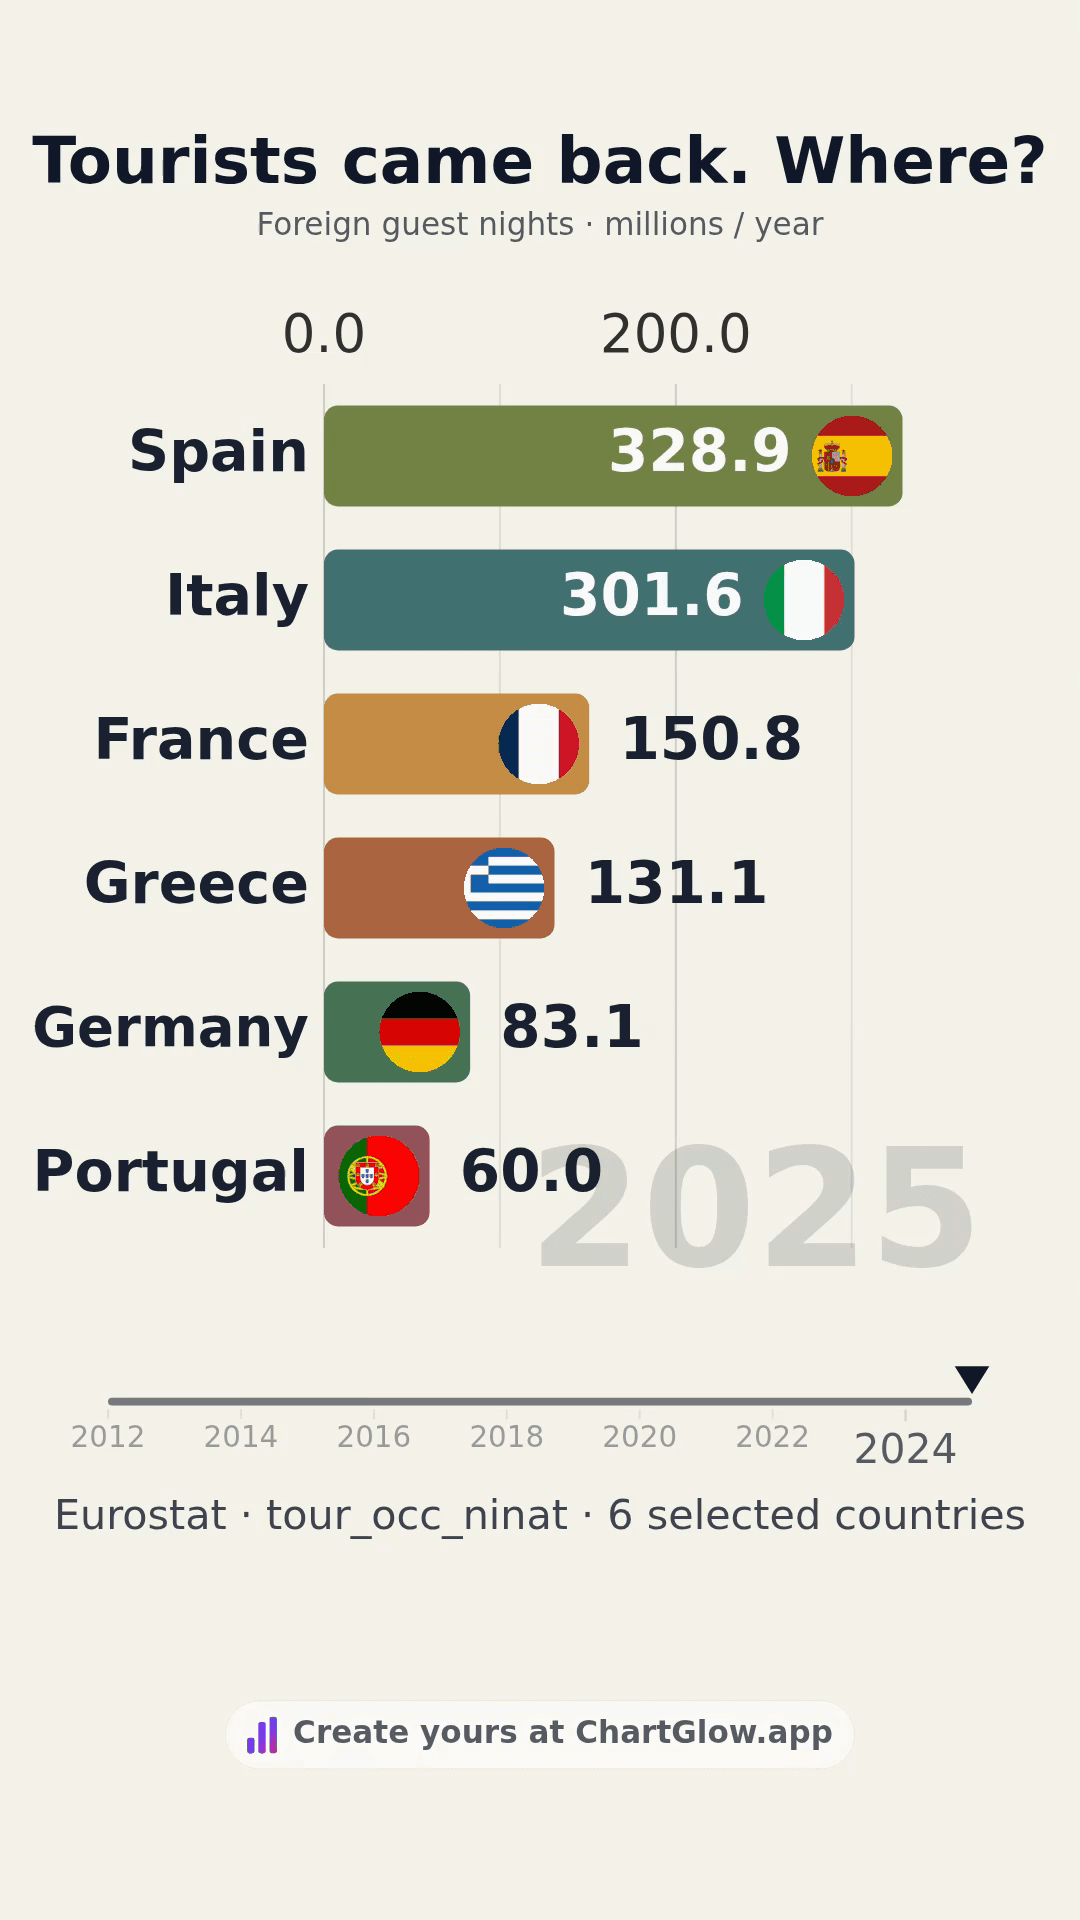
Europe’s tourist comeback · 2012–2025
Six destinations, 84 annual observations. Follow the fall and recovery of foreign overnight stays.
Watch video →
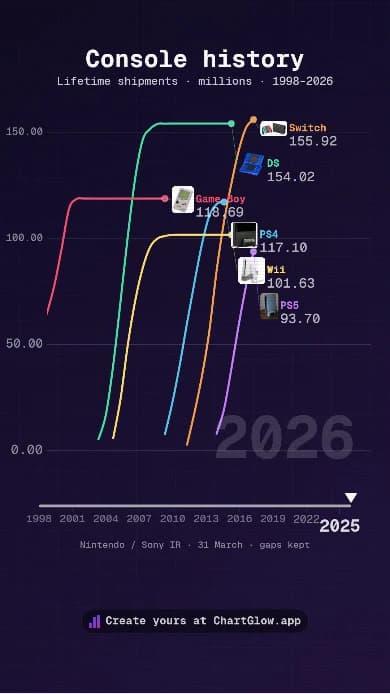
Console history: six gaming generations
From Game Boy to PS5: six handheld and home-console families across nearly three decades.
Watch video →
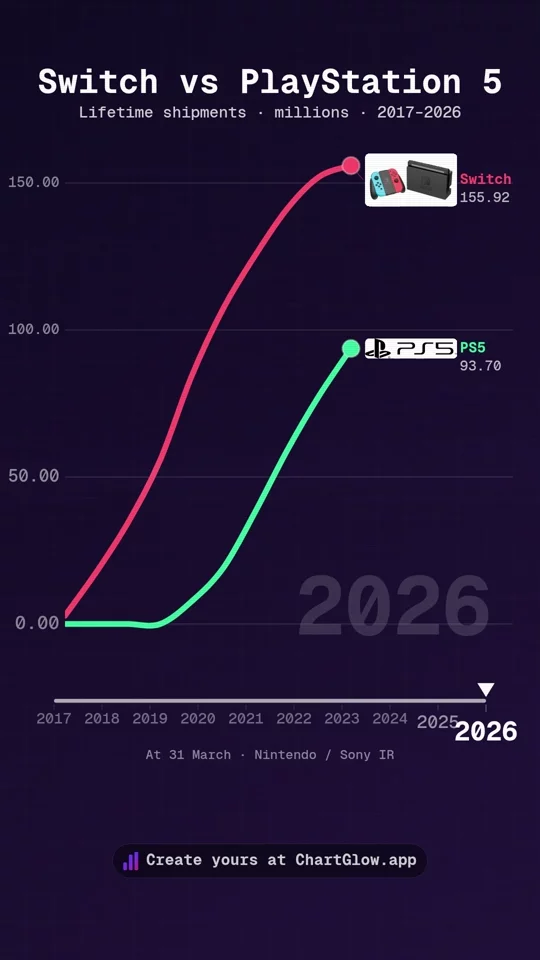
Switch vs PS5 · Lifetime shipments · 2017–2026
Lifetime console shipments, 2017–2026. Different launch dates, two growing totals.
Watch video →
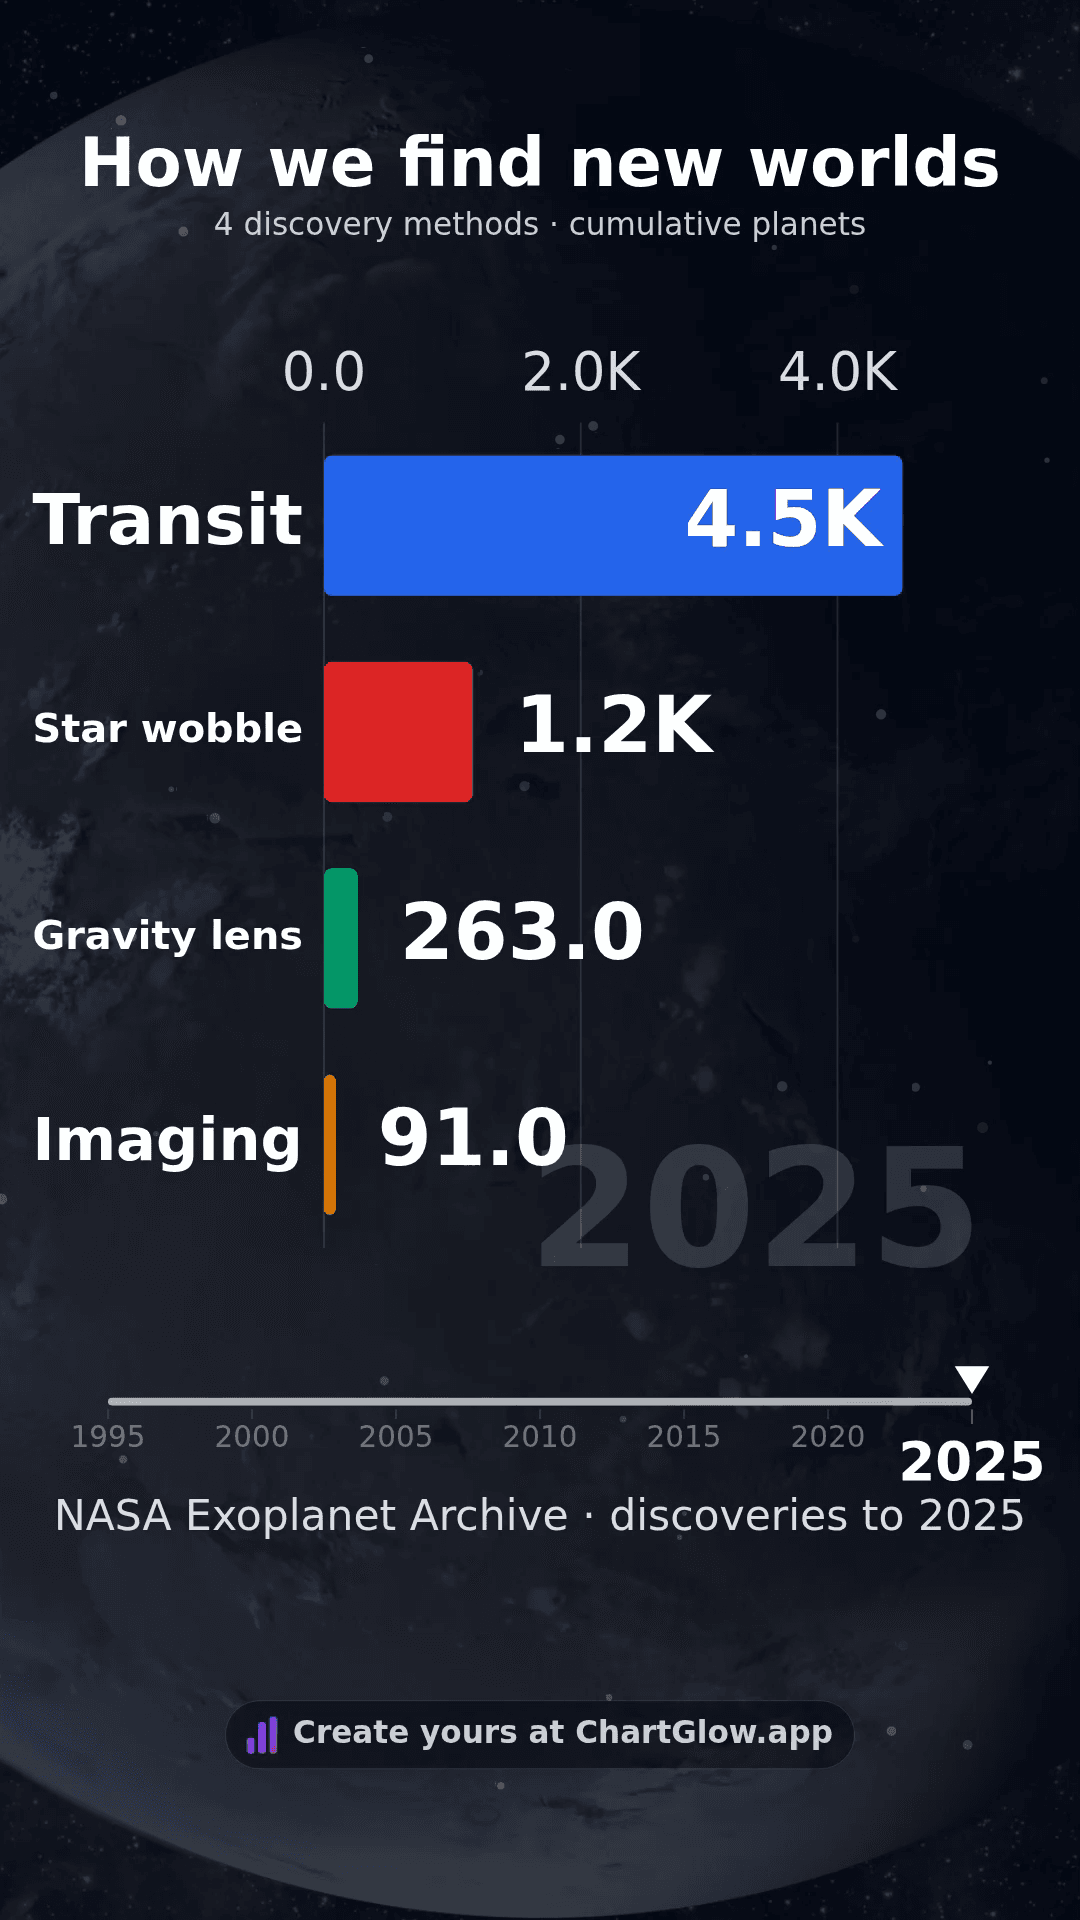
How we find new worlds
Four ways to find new worlds: 124 cumulative counts, 1995–2025. These methods cover 6,020 of 6,090 confirmed planets through 2025; other methods are omitted. Counts use the 15 Oct 2026 archive snapshot, classified retrospectively, not historical archive snapshots. Do not add years together. Movement between annual counts is interpolated.
Watch video →
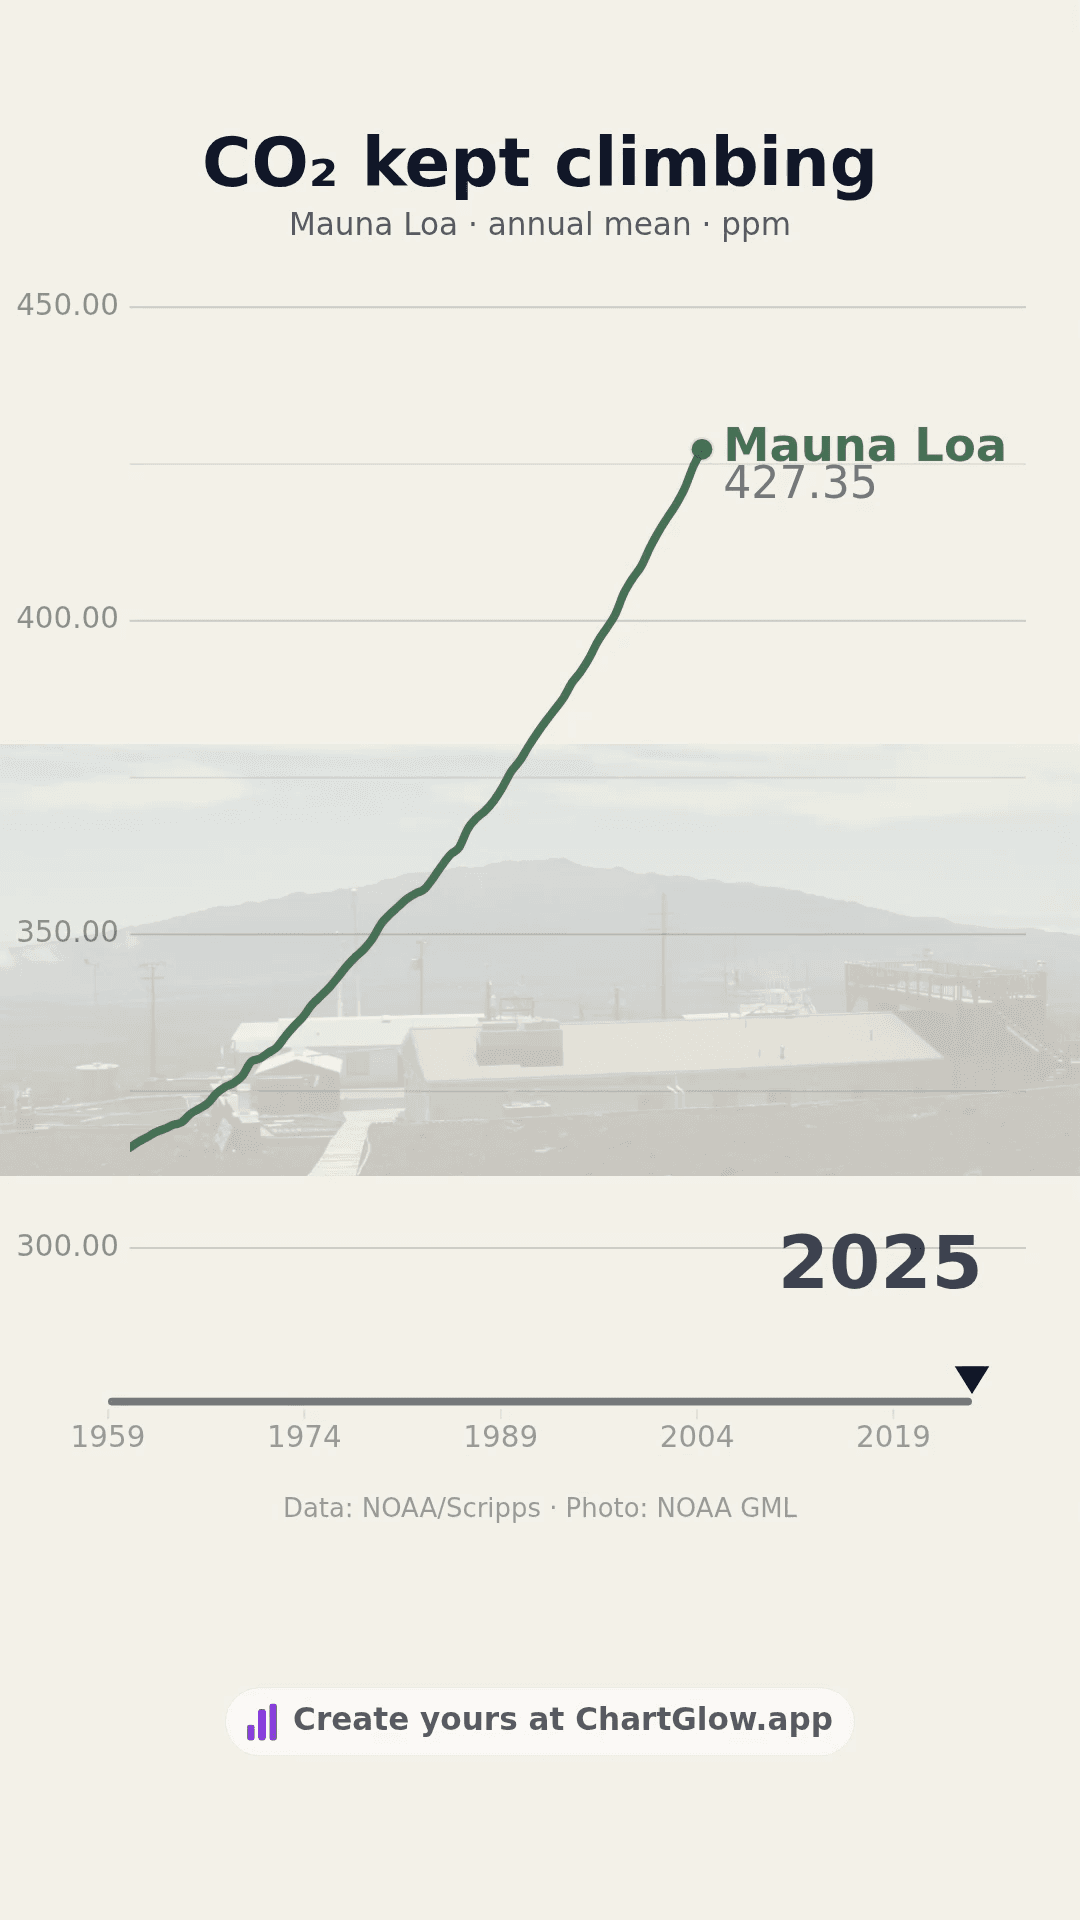
CO₂ kept climbing: Mauna Loa
67 annual CO₂ readings, 1959–2025. Concentration, not emissions. Maunakea observations temporarily replace Mauna Loa in 2022–2023; values may be revised. Movement between years is interpolated. The labeled chart scale starts at 300 ppm.
Watch video →
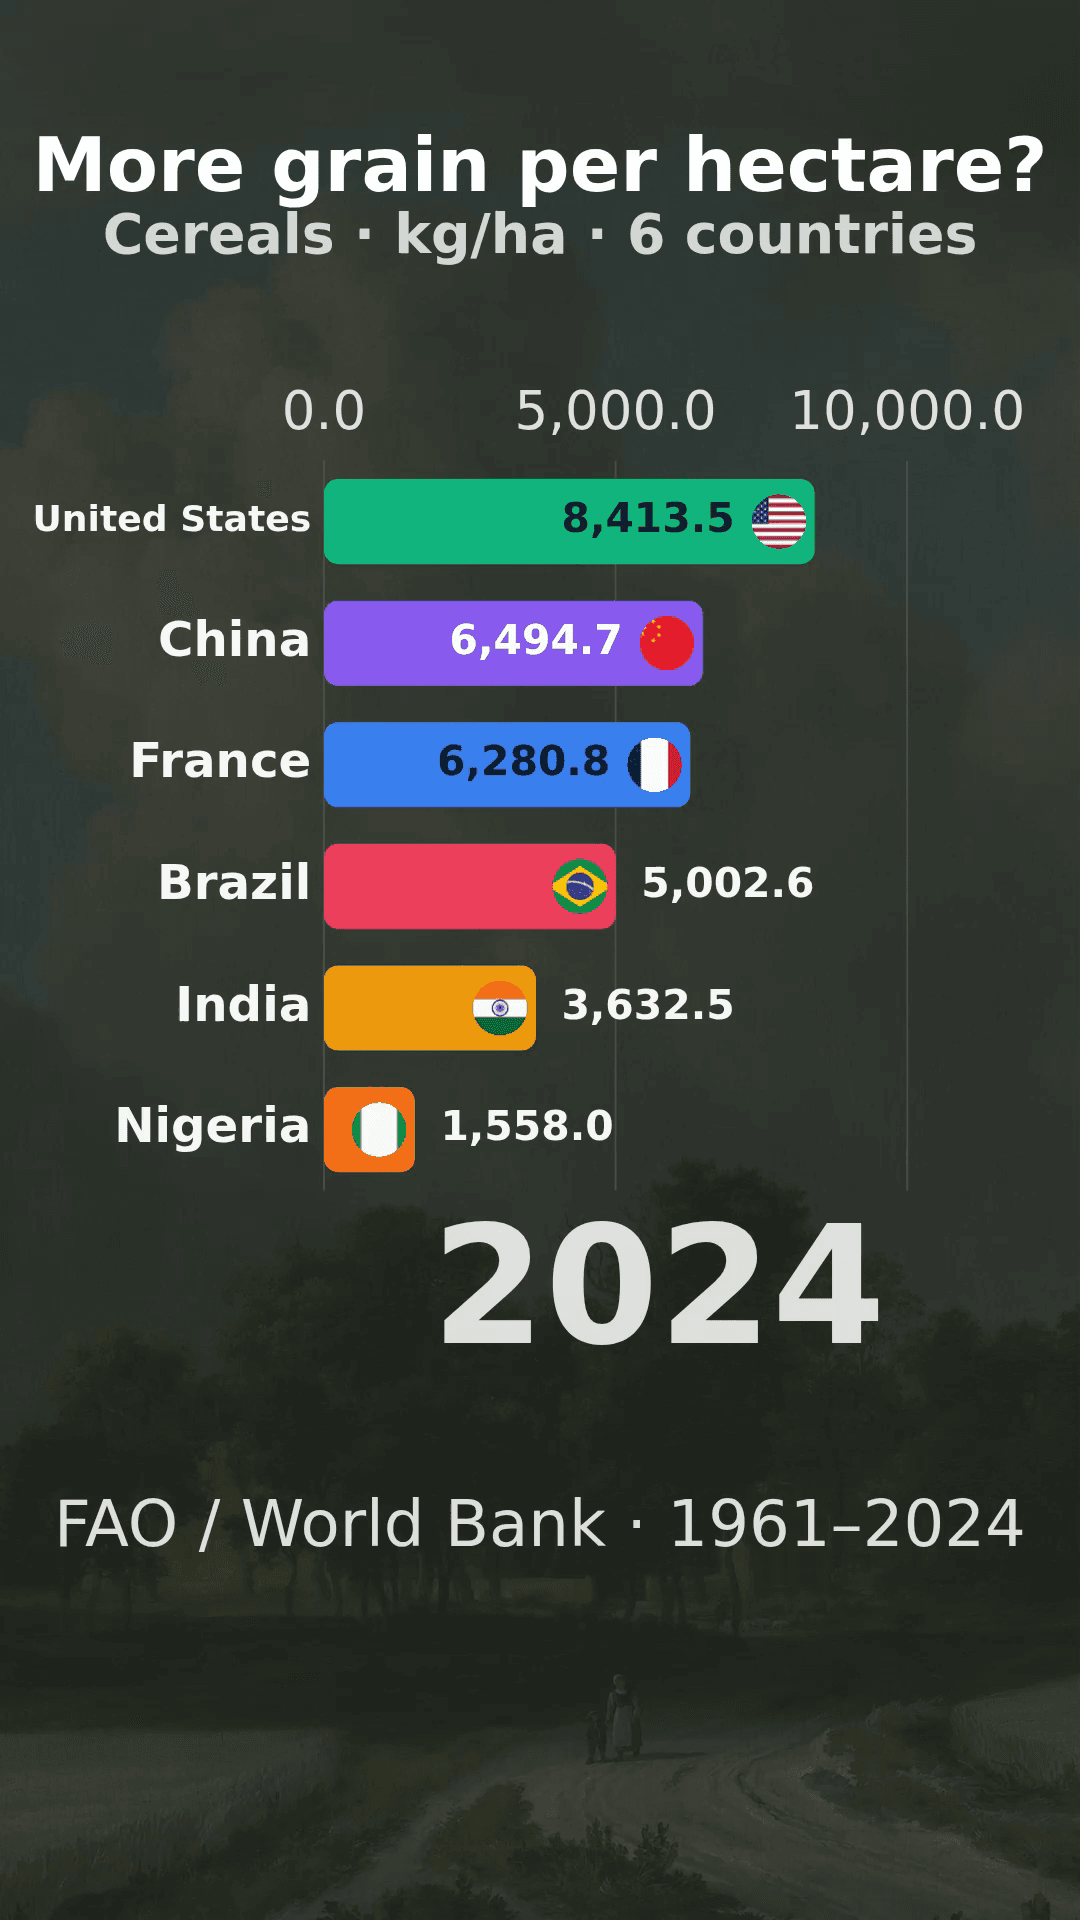
Cereal yields per hectare, 1961–2024
Six countries, 384 annual observations. Compare grain harvested per hectare, without adding country yields.
Watch video →
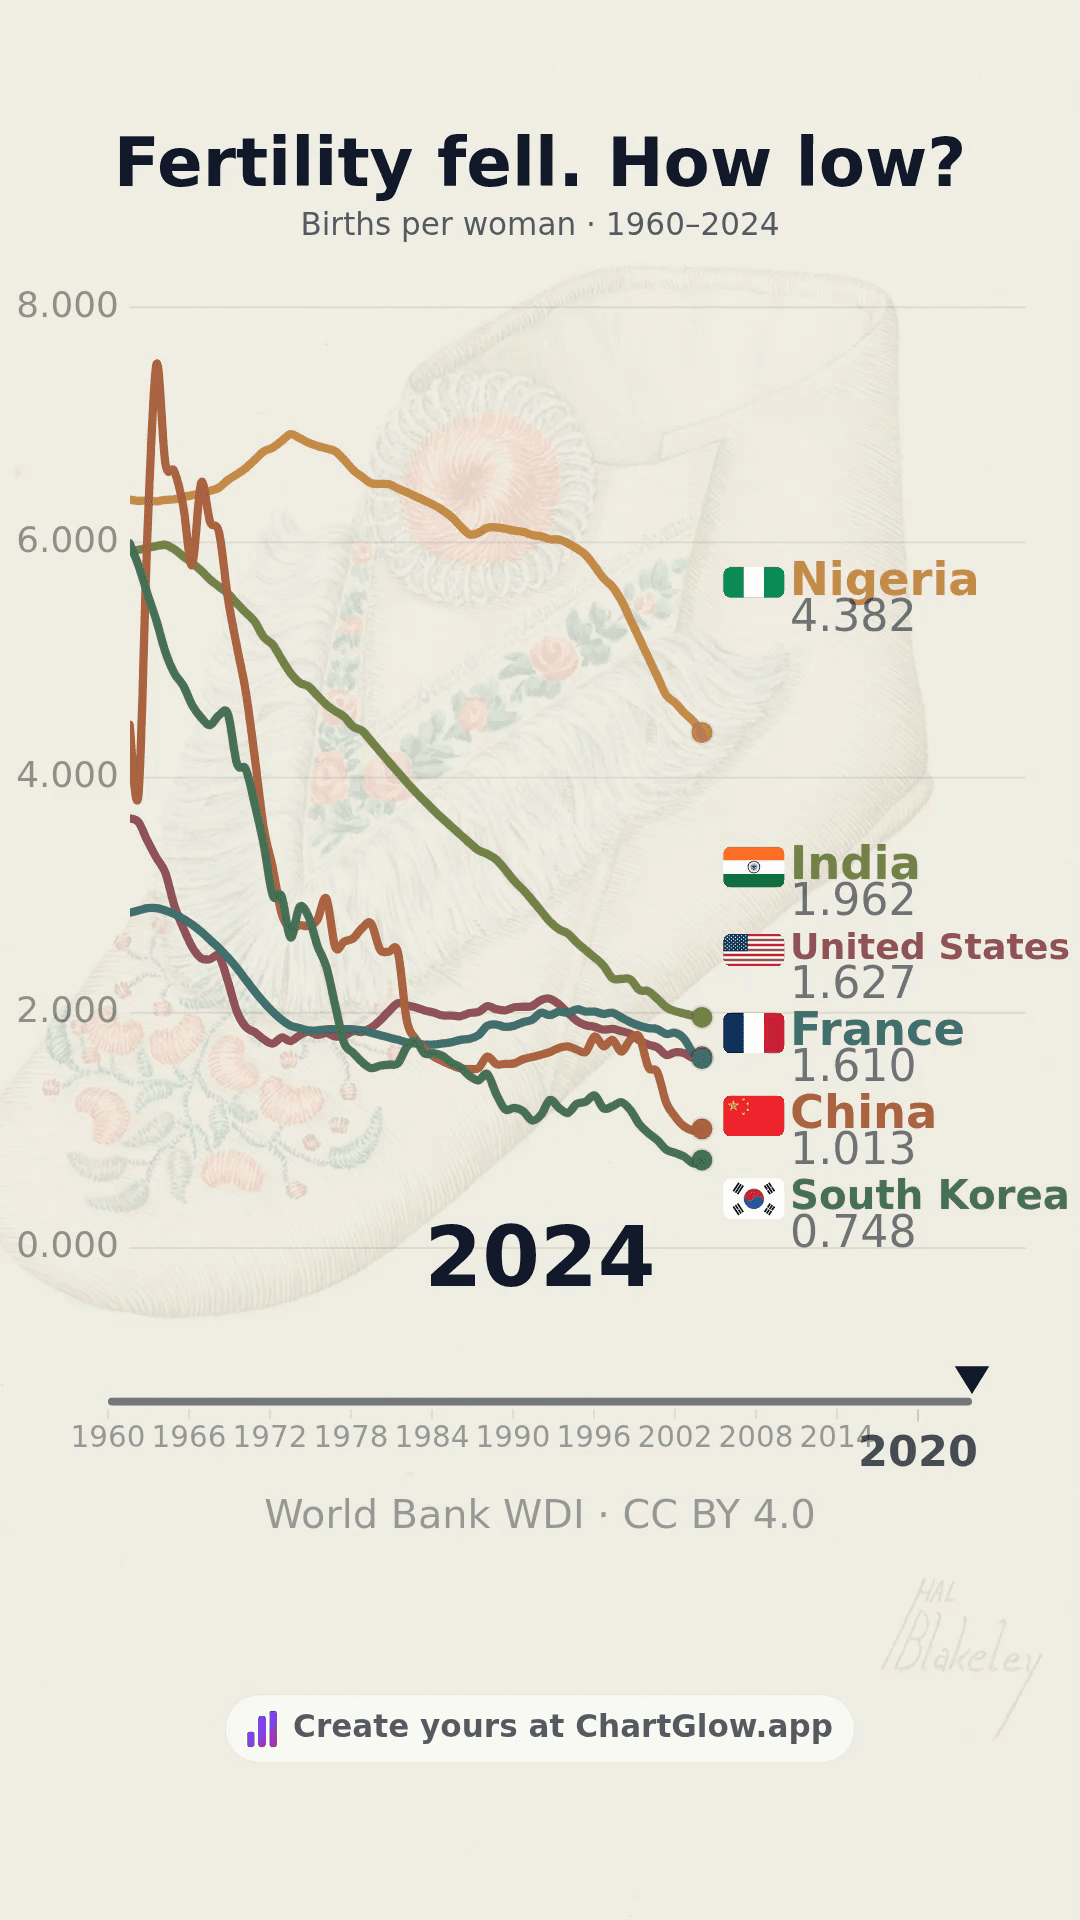
Fertility fell. How low did it go?
Six countries, six changing fertility paths.
Watch video →
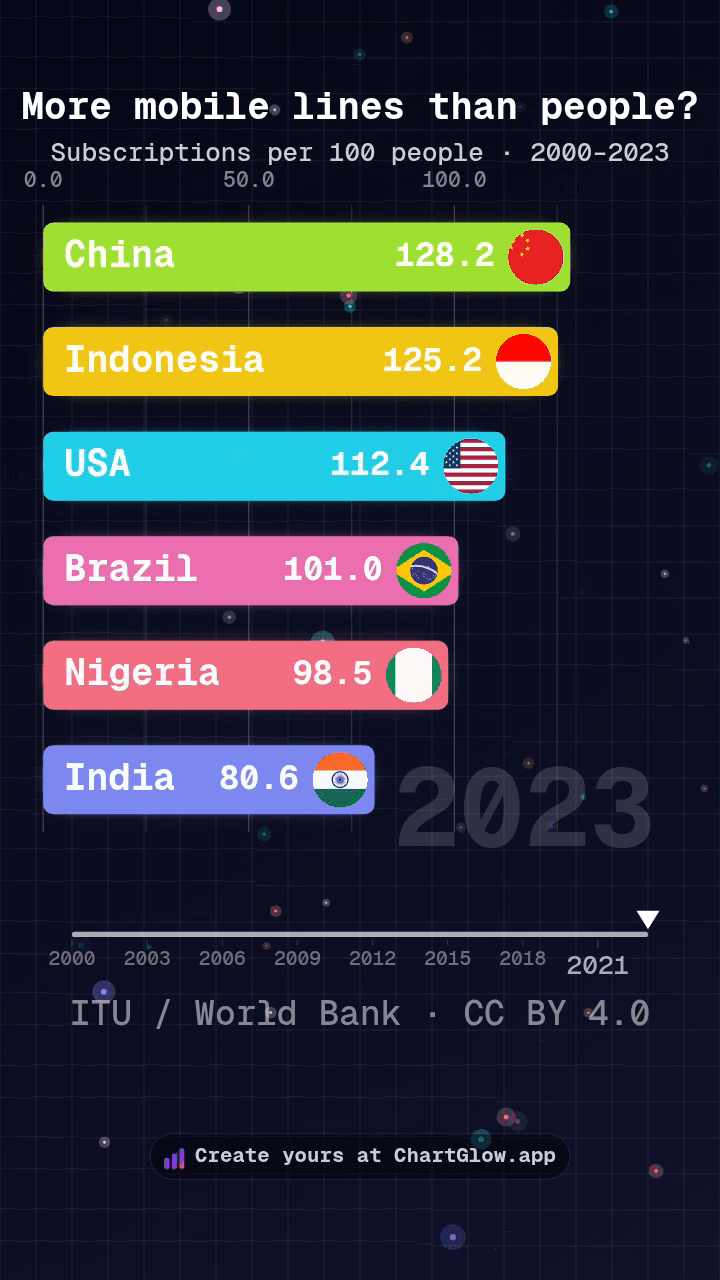
More mobile lines than people?
Six countries, 2000–2023. Subscriptions can exceed 100 per 100 people; they are not unique users.
Watch video →
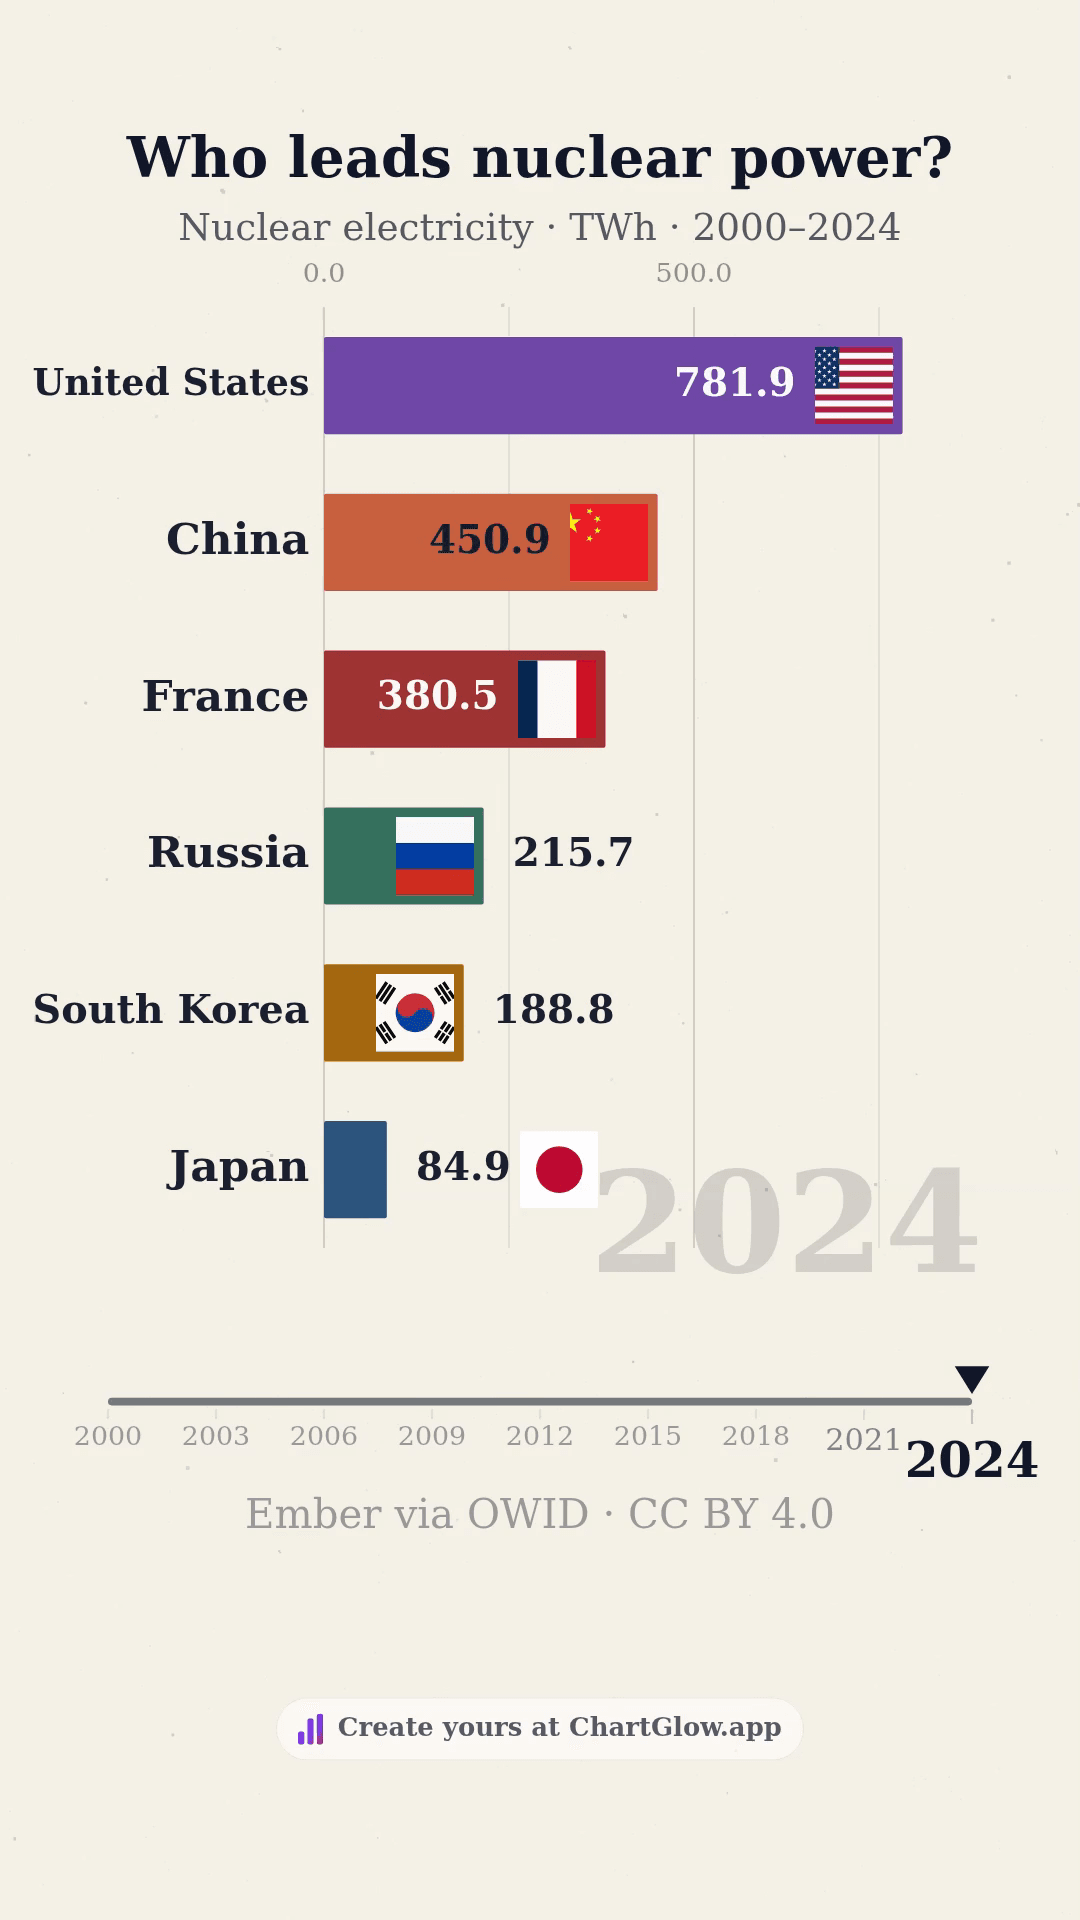
Who leads nuclear power?
Annual nuclear electricity generation across six selected countries.
Watch video →
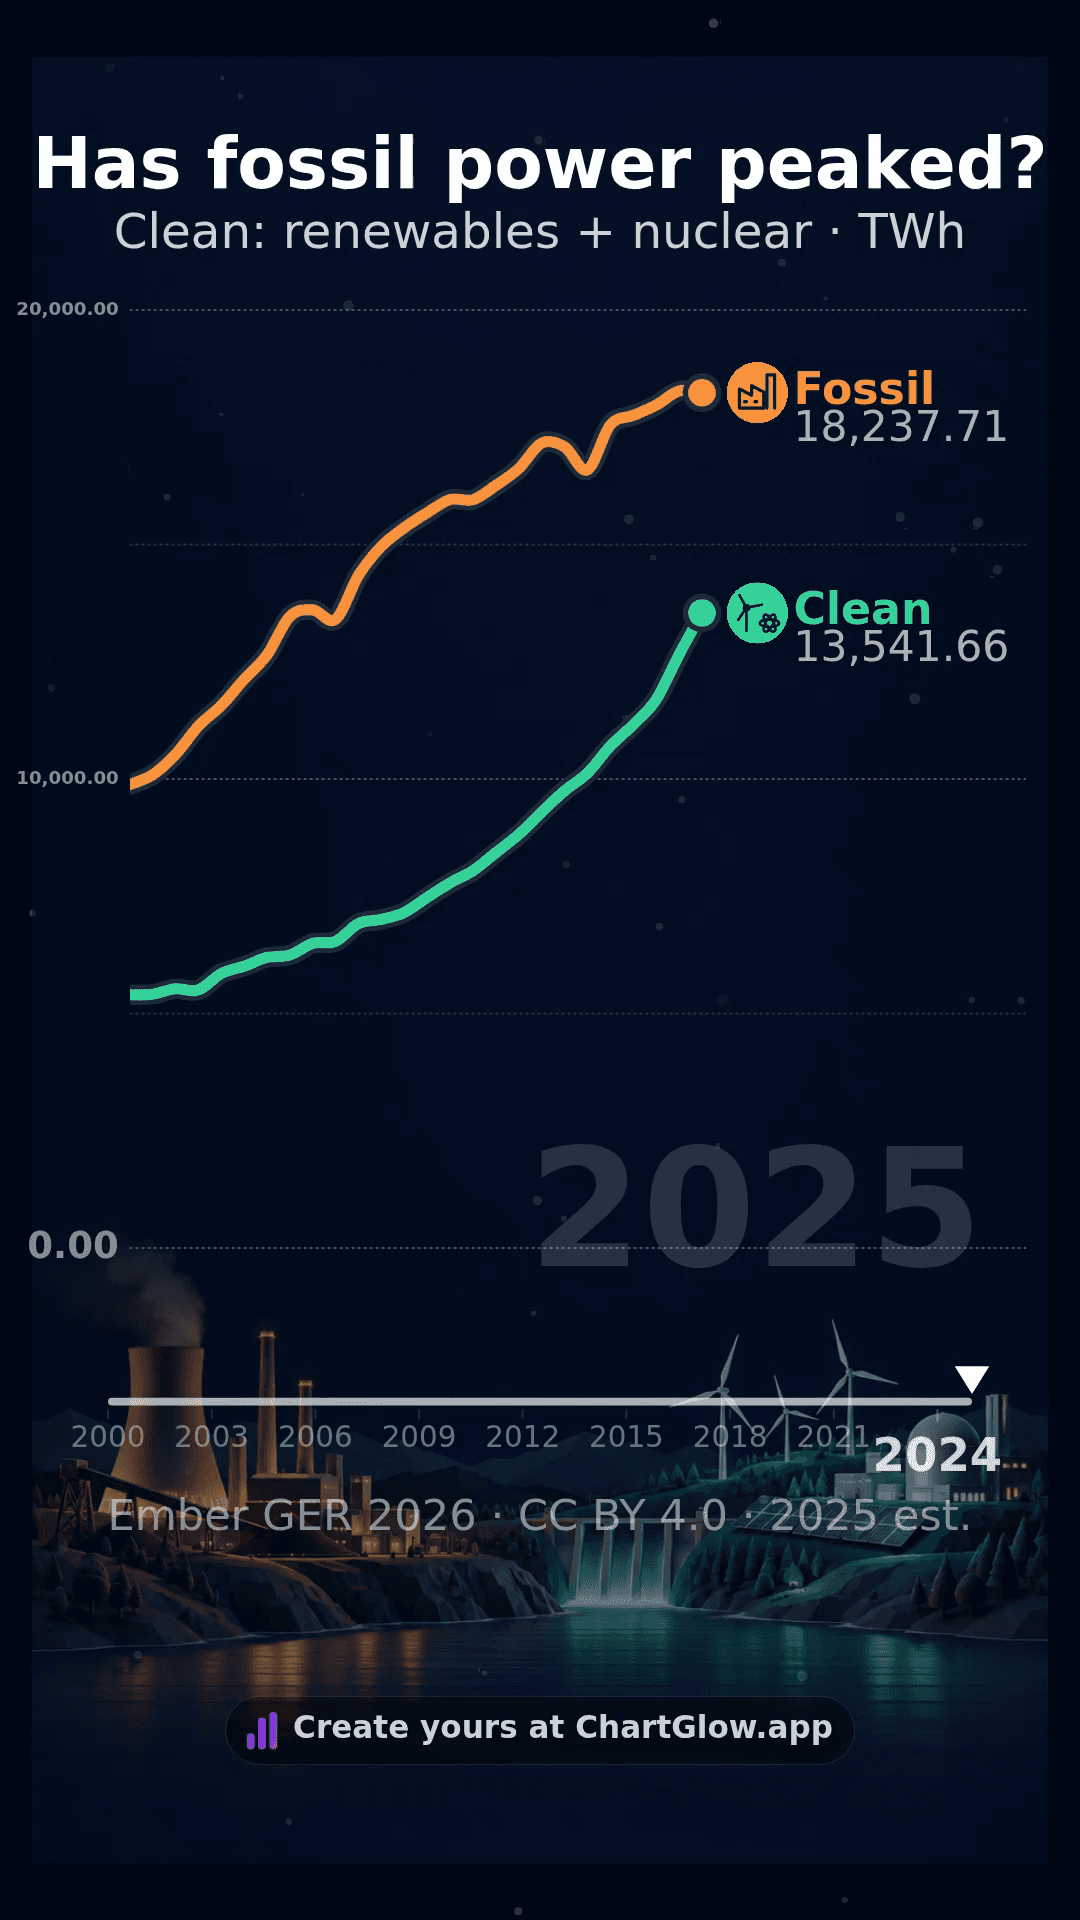
Has fossil power peaked?
Fossil and clean electricity generation, 2000–2025.
Watch video →
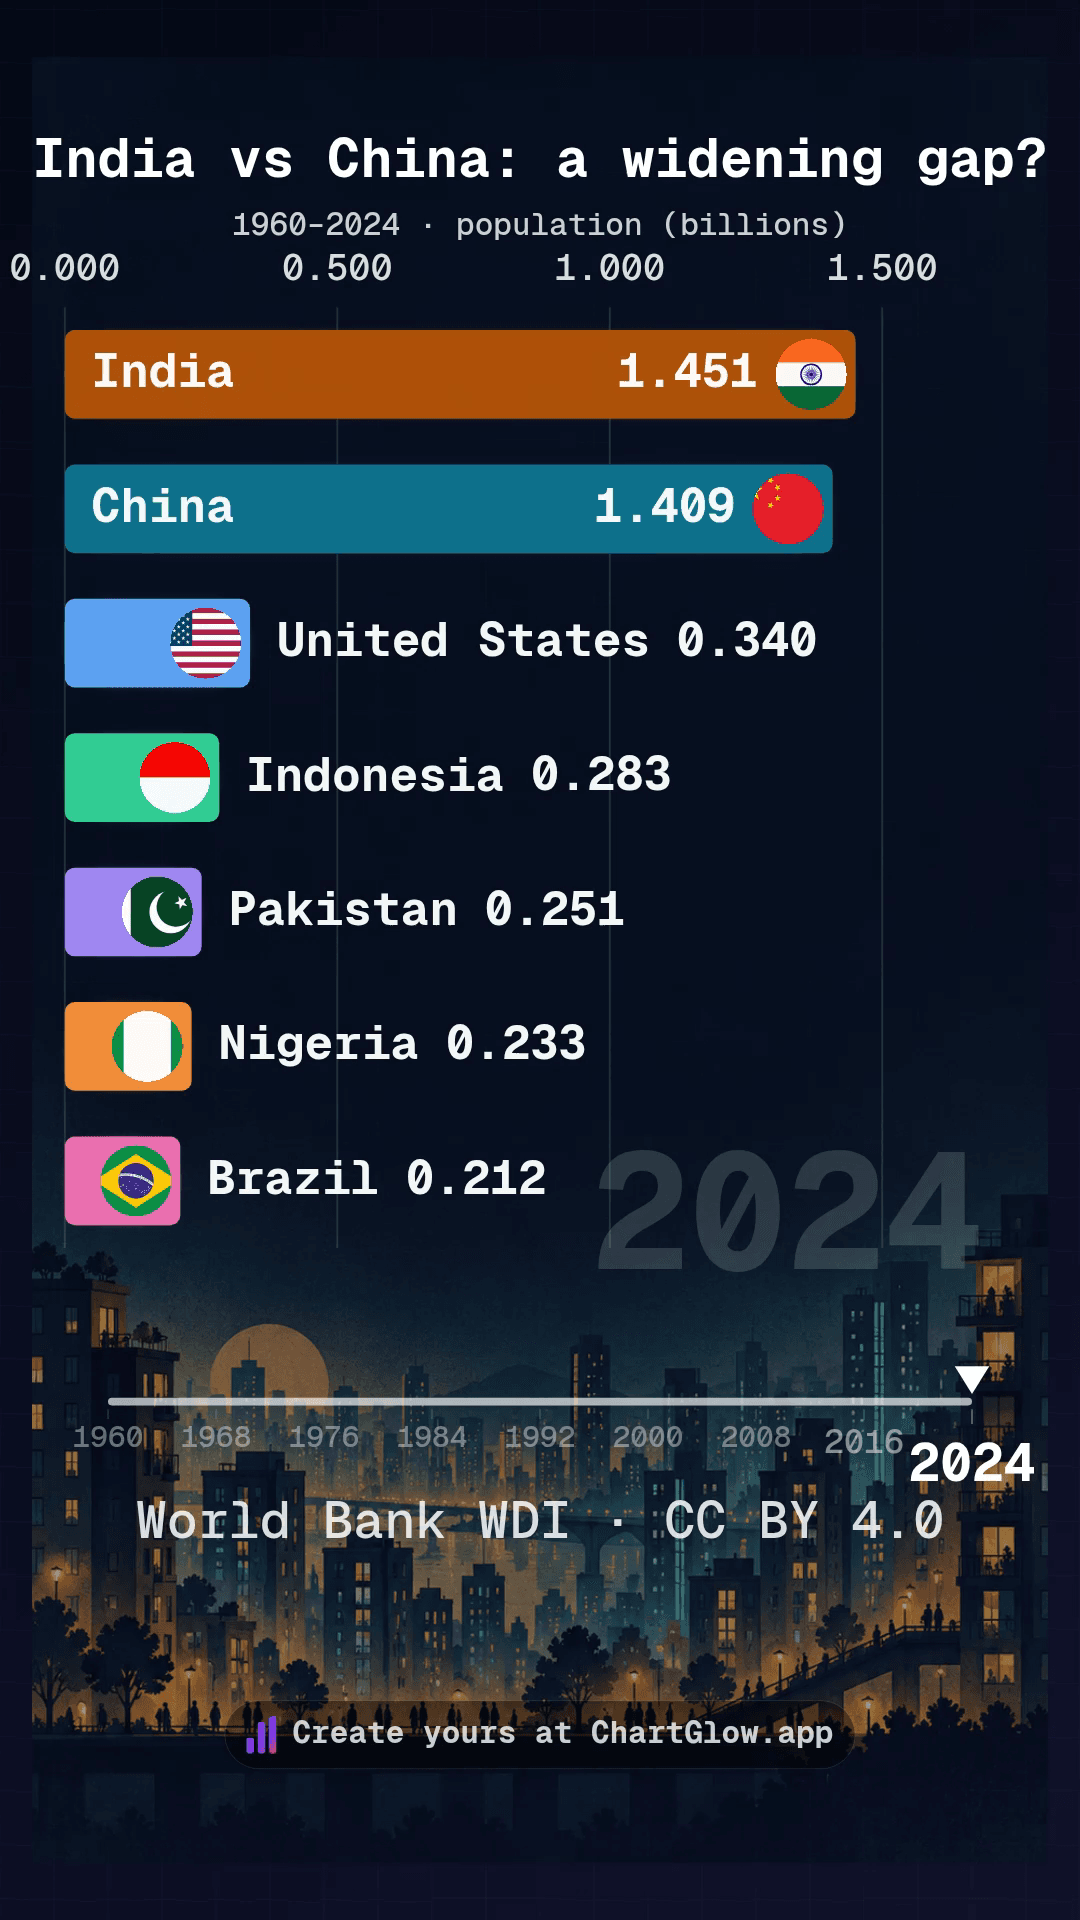
India vs China: a widening gap?
Seven selected countries, with a focus on India and China.
Watch video →
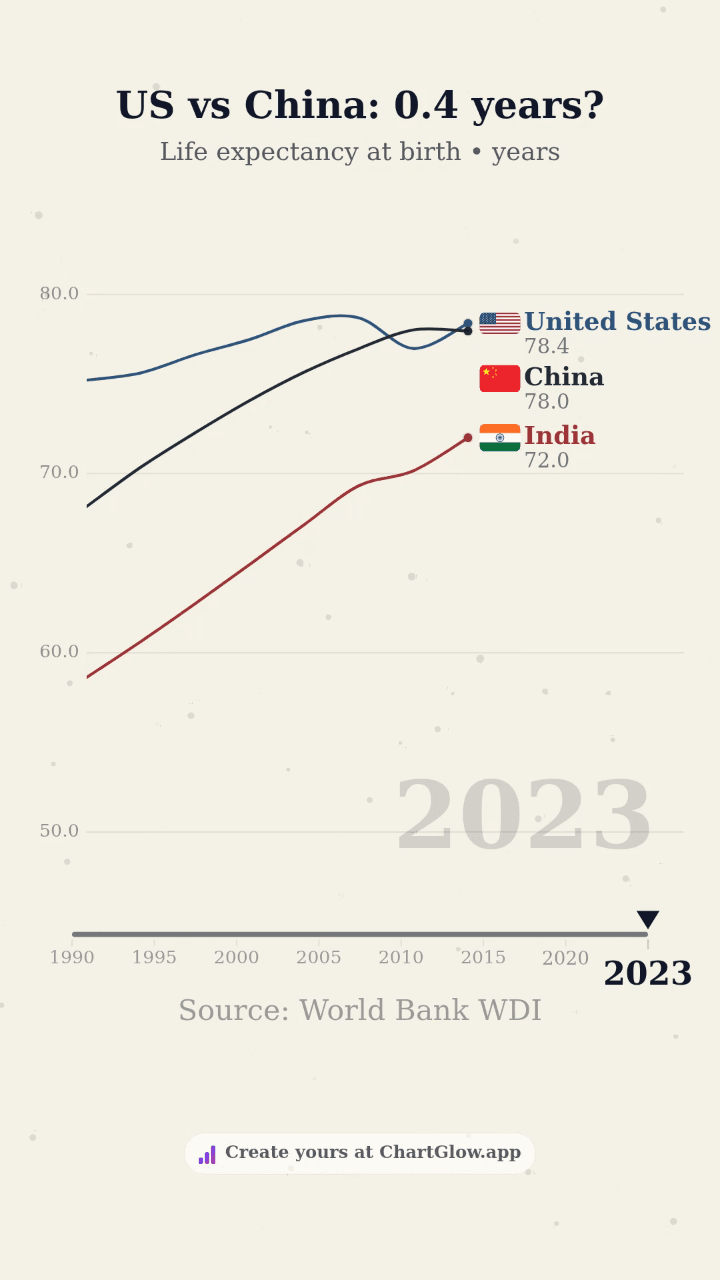
Life expectancy: US, China & India
Three countries, three changing trajectories.
Watch video →
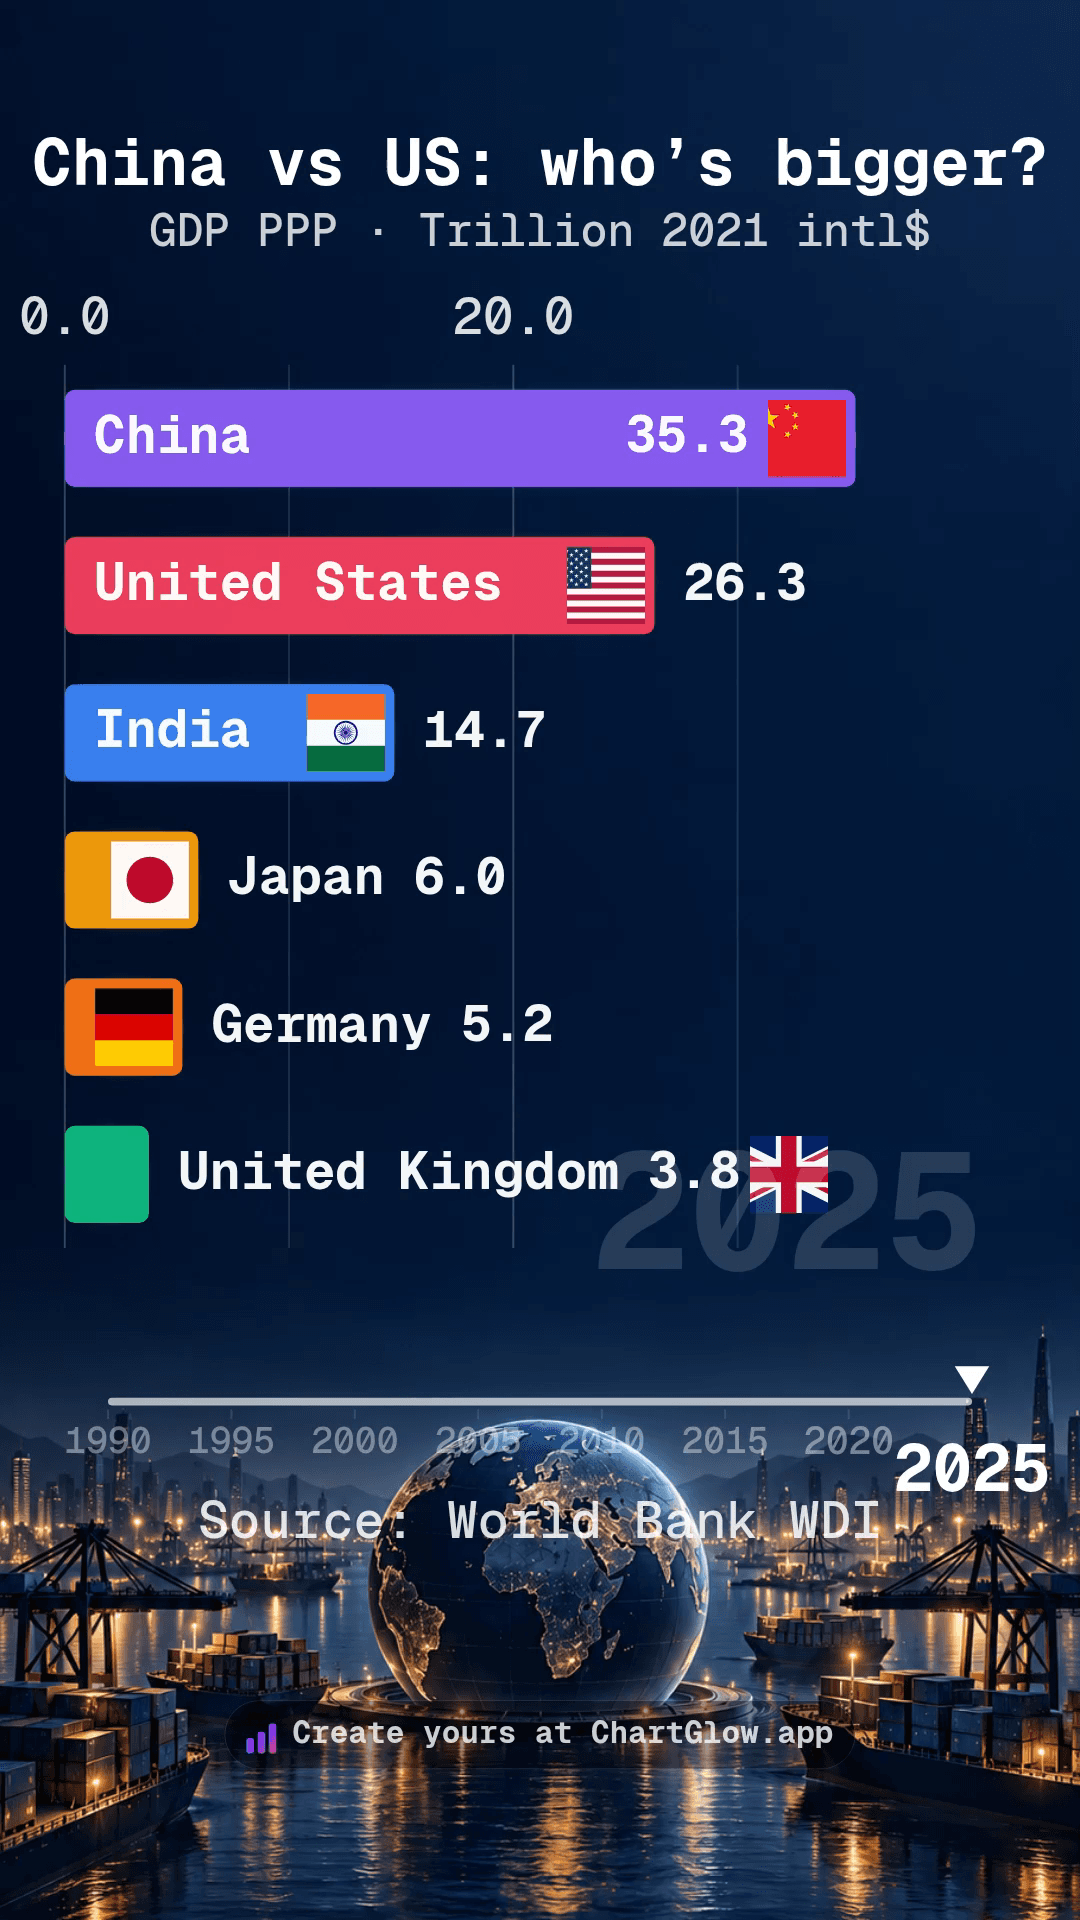
China vs US: who’s bigger?
Six selected economies. One changing picture.
Watch video →