Practical guide · Exoplanets Bar Race
Make a Bar Race with NASA exoplanet data
Show how four discovery methods built up their planet counts from 1995 to 2025. Start with the finished ChartGlow project, change its look, then export a readable MP4.
1. Choose your starting point
Open the complete project to preview the animation and keep its portrait layout, labels and illustration. Choose Use this project when you want to make your own version.
The dataset has the same numbers with a starter chart. Choose Use this dataset if you want to build the design yourself. You only need one option.
Sign in and confirm your email if asked, return to the same item, then choose its Use button. Signing in alone does not create a chart. The button creates a separate chart in your account without replacing your existing work.
Free accounts allow 5 saved projects. At the limit, you can continue editing an existing chart. Free exports keep the ChartGlow watermark. This walkthrough uses supplied data and manual controls; no AI generation is needed.
2. Read the counts correctly
The example has 124 cumulative counts: 31 years, 1995–2025, across four discovery methods. The unit is confirmed planets, not a percentage or the number of planets in the universe.
At each year, a bar counts planets in the saved archive selection whose discovery year is that year or earlier. Do not add the years together: the same planet contributes to later cumulative counts. These are not new discoveries per year.
The NASA Exoplanet Archive snapshot was retrieved on 15 October 2026. Its selection of planets with discovery years through 2025 contains 6,090 unique planets. The four methods shown cover 6,020 of them; other methods are omitted. No 2026 discoveries are included.
The archive classifies these records retrospectively. A bar for 1995 is not a preserved snapshot of everything the archive or astronomers knew in 1995. Future archive revisions may change the counts.
Two labels are shortened: Star wobble = Radial Velocity and Gravity lens = Microlensing. Transit and Imaging keep their archive names. Keep these explanations with the chart.
3. Keep the mappings simple
Open Data to inspect the table. In Columns, use Method for the entity, Year for time and Planets for the value. Keep years ascending and the supplied numbers unchanged. If you started from the dataset, choose Bar in Chart.
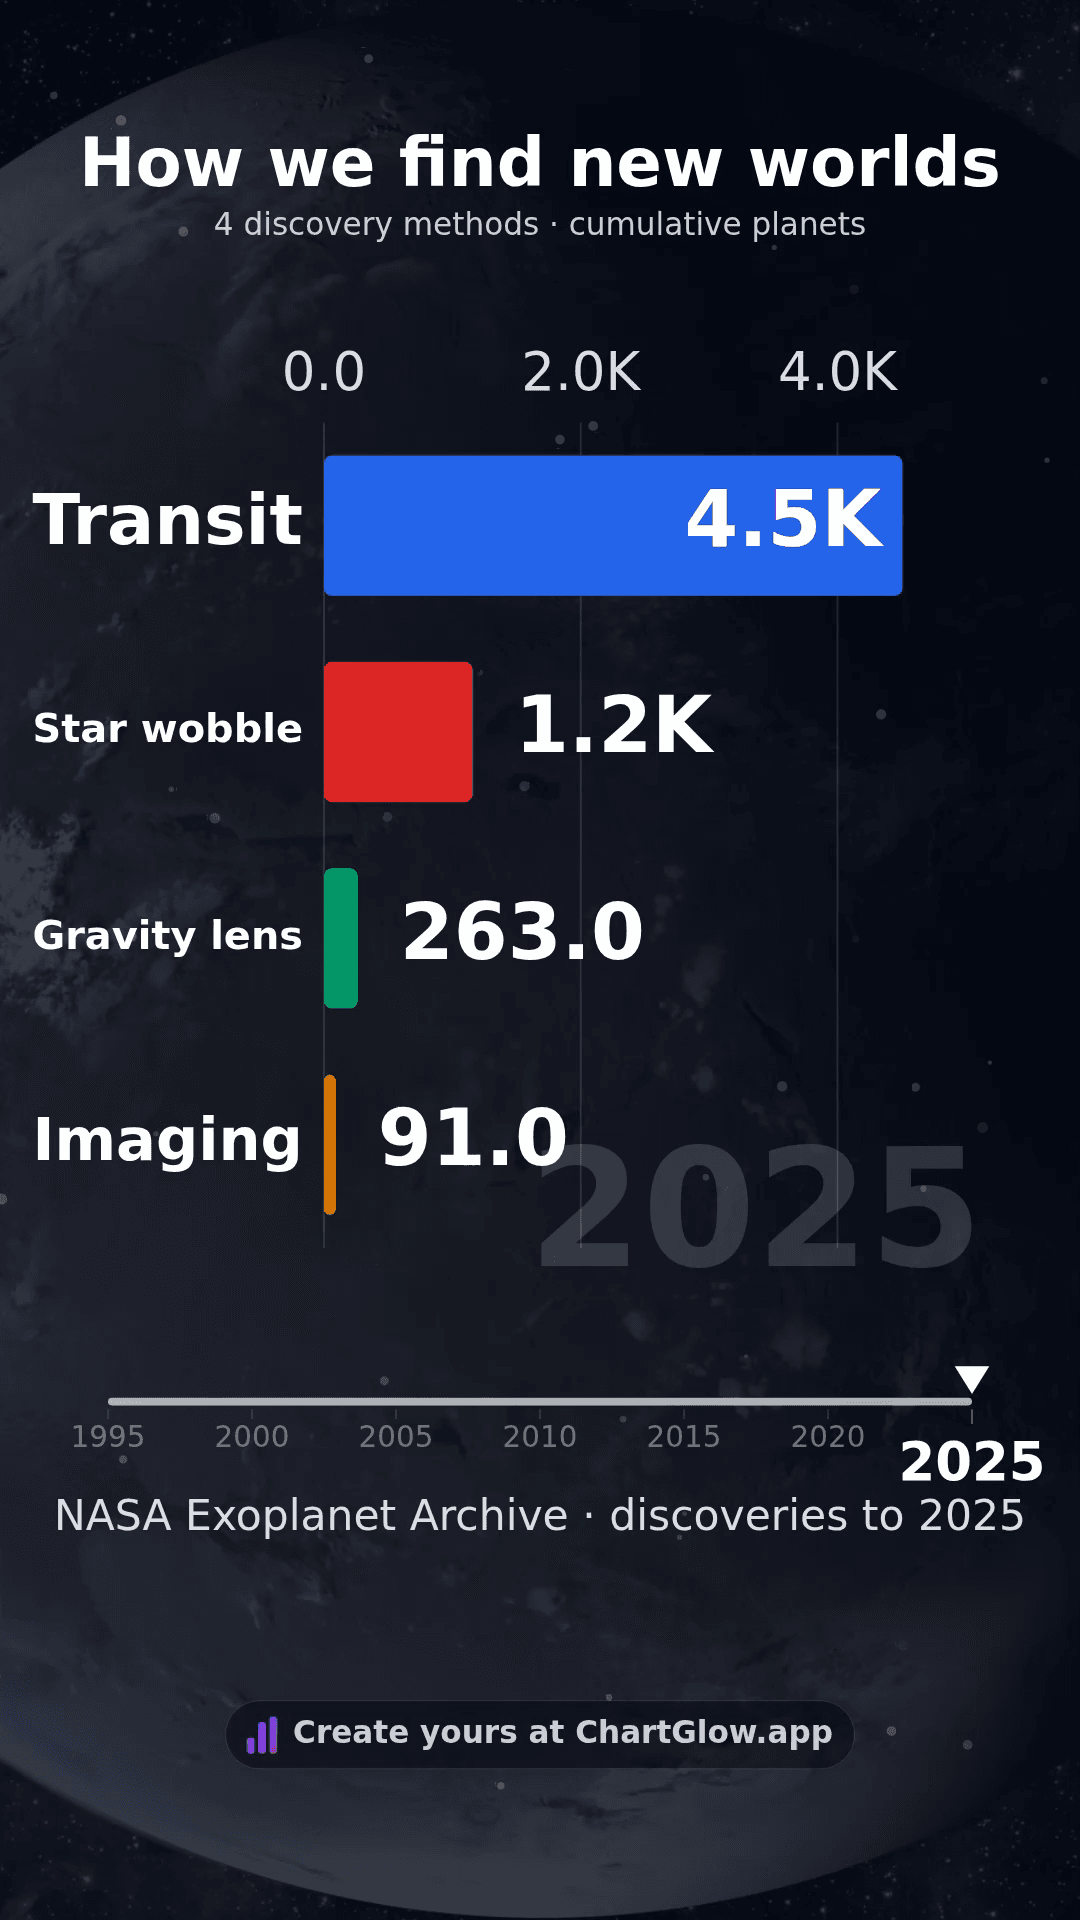
A useful end check is 2025: Transit 4,507, Star wobble 1,159, Gravity lens 263, Imaging 91. Together they total 6,020 for that year only. Keep Labels → Show Summary off, as in the complete project, to avoid presenting an unexplained total.
Need a file? Download the same CSV. A CSV carries data rather than the finished design; use the CSV guide for import details.
4. Personalize without hiding the numbers
Keep a short title such as How we find new worlds, and a subtitle such as 4 discovery methods · cumulative planets. Keep a visible NASA Exoplanet Archive credit and explain the selection beside the chart.
The complete project uses Classic rendering with a Midnight background, Portrait (9:16) and a subtle Kepler-62f illustration at 20% opacity. Keep the image behind the chart. This is an artist’s concept, not a telescope photograph.
For a fresh layout, choose the chart type and format before applying Platform Safe Zones → Universal. The finished project already includes its accepted positions; keep them when following this example. Keep Dynamic Bar Height on and Max Items at 4. Its 22% top margin leaves space between the subtitle and the horizontal-axis values. If you change the theme, check label positions again.
Play Preview at desktop and phone size. Read the title, subtitle, horizontal-axis values, method names, year and source together at the beginning, in crowded moments and at the end. Around a rank change, look before, during and after the crossing: names should become readable again. Fix sustained overlap rather than judging one transition frame. Wait for Saved, reload the same chart, and check your changes.
Movement between annual counts is visual interpolation, not extra observations. A smooth or fractional in-between value is not a newly observed fraction of a planet. For more context, see how to read racing charts.
5. Export and open the MP4
Open Export in the editor header, choose Format → MP4, then an available Resolution and Smoothness. MP4 offers 720p or 1080p and 30 or 60 FPS; portrait 1080p is 1080 × 1920 pixels. Encoding depends on your browser and device.
Choose Start Export and keep the tab open. Open the downloaded MP4 and check the beginning, crowded transitions and end at phone size. Confirm that the subtitle and axis values remain readable together. A completion message alone does not confirm a usable video. Export downloads a file; it does not publish a social post.
Use the social-video export guide for more detail, or watch the existing native MP4 without making a copy or exporting again.
Sources and reuse
- Data: NASA Exoplanet Archive, Planetary Systems Composite Parameters, saved selection retrieved 15 October 2026, discovery years through 2025. The archive is operated by Caltech under NASA’s Exoplanet Exploration Program; retain the archive acknowledgement. The supplied counts are unchanged.
- Illustration: Kepler-62f artist concept, credit NASA/Ames/JPL-Caltech. Reuse follows the JPL image-use policy; retain the credit and do not imply endorsement. The illustration represents one world, not an image of each discovery method.
- Saved source, transformation and rights record.